Self-Supervised Learning Methods on Corss-tissye Spatial Transcriptomics Data (MOSTA)
Evaluating 8 SSL methods with 3 GNN architectures on large-scale mouse embryo spatial transcriptomics data reveals interesting performance of reconstruction-based approaches
Tech Stack
Tags
Self-Supervised Learning Methods on Corss-tissye Spatial Transcriptomics Data (MOSTA)
Building on the previous exploration with SiT mouse brain data, this study evaluates the same self-supervised learning framework on a substantially larger and more complex dataset to assess scalability, cross-tissue generalizability, and method robustness.
Table of Contents
Introduction
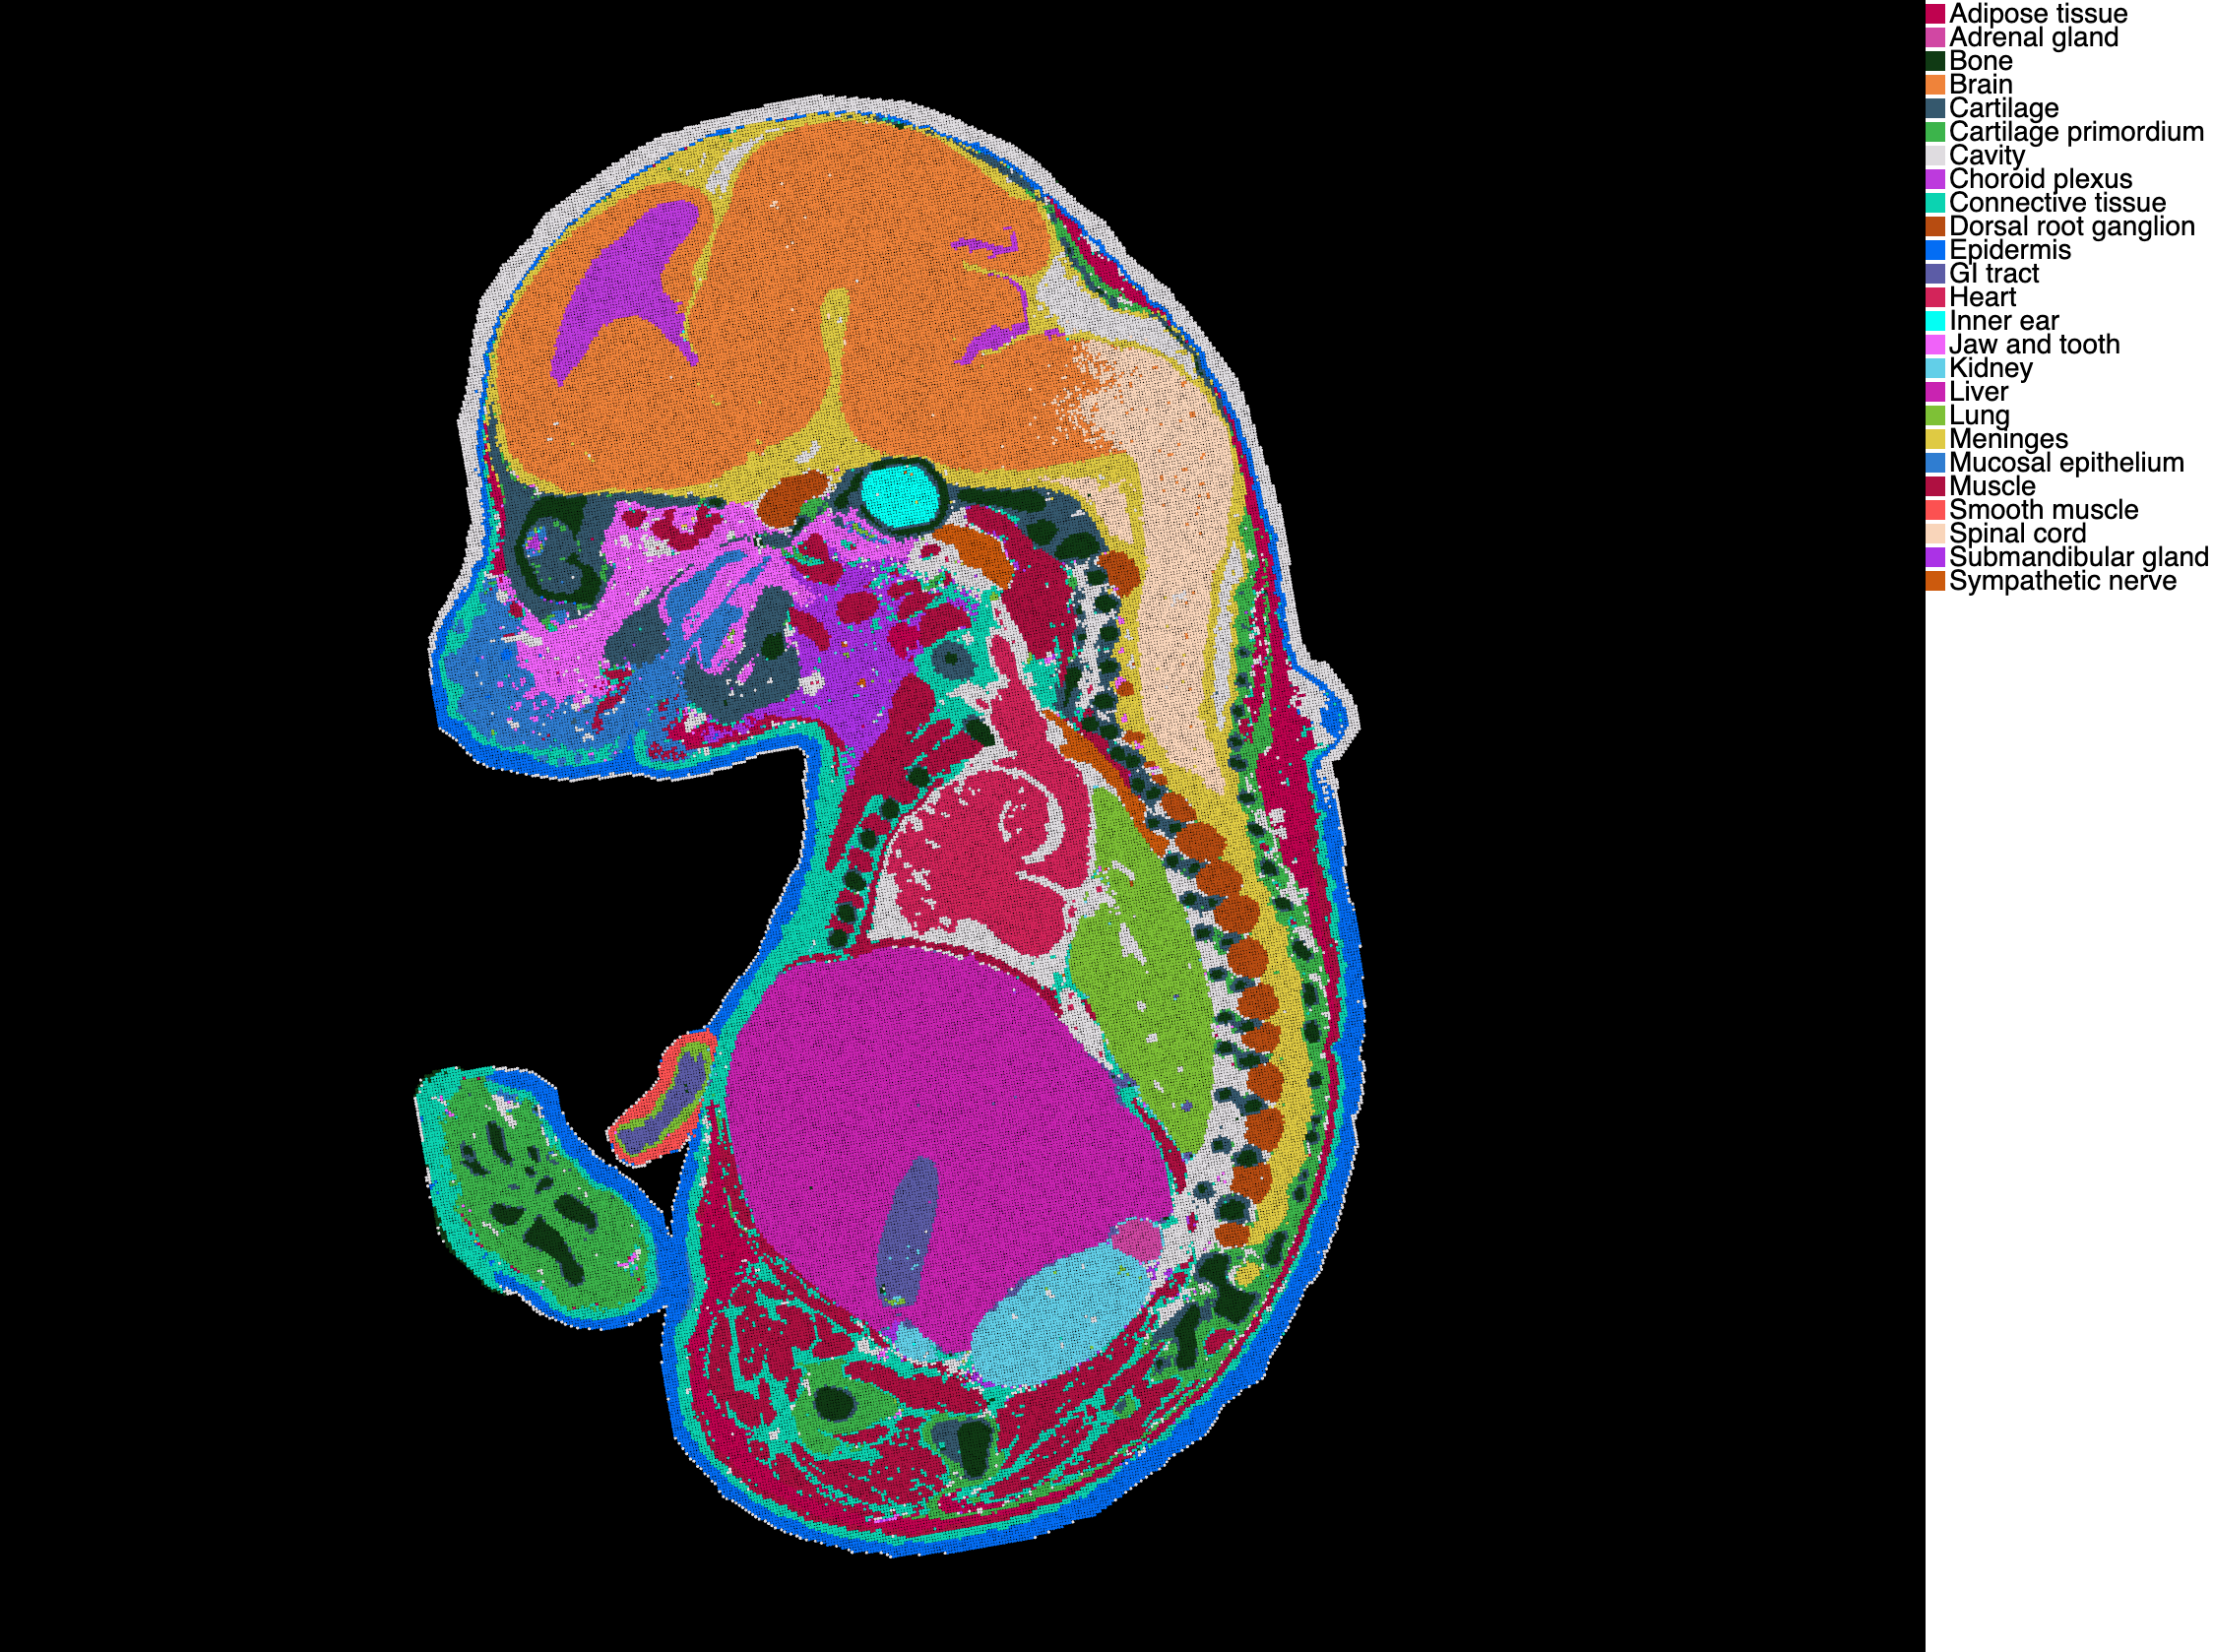
The MOSTA Dataset
This analysis uses the MOSTA (Mouse Organogenesis Spatiotemporal Transcriptomic Atlas) dataset, specifically the E16.5_E1S1 section from Chen et al., 2022. This dataset represents a significant scale-up from the SiT data:
- 121,767 spatial spots (47× larger than SiT)
- 28,204 genes, filtered to 3,000 highly variable genes (HVGs)
- Spatial coordinates capturing complex tissue architecture
- 25 annotated tissue types/regions including Brain, Liver, Heart, Kidney, Lung, Spinal cord, and diverse organ systems from developing mouse embryo
Key Differences from SiT Study:
- Scale: ~50× more spots, enabling evaluation of scalability
- Complexity: Multi-organ embryonic tissue vs. single brain region
- Heterogeneity: 25 tissue types vs. 13 brain regions
- Biological Context: Developmental biology vs. neuroanatomy
Research Question: Do the patterns observed in small, single-tissue datasets generalize to large-scale, multi-organ spatial transcriptomics data? How do different SSL methods scale with data size and complexity?
Graph Construction
Following the same approach as the SiT analysis, a k-nearest neighbor spatial graph (k=6) was constructed based on Euclidean distances between spot coordinates, resulting in 121,767 nodes and 1,461,204 edges.
Methods
GNN Architectures
The same three GNN architectures were evaluated:
- GraphSAGE (SAGEConv): Mean-pooling aggregation from sampled neighbors
- Graph Attention Networks (GATConv): Learned attention weights (4 heads)
- Graph Convolutional Networks (GCNConv): Spectral graph convolutions
Architecture specifications:
- 2 GNN layers
- Hidden dimension: 256
- Projection dimension: 64
- Batch normalization and dropout (0.1)
Self-Supervised Learning Methods
The same eight SSL methods were compared: SimCLR, SwAV, BYOL, MoCo, SimSiam, MAE, Barlow Twins, and VICReg
Data Augmentation: Gene dropout (10%) and Gaussian noise (scale=0.005)
Training: 12 epochs (reduced from 20 due to dataset size; save time with limited computation resources), batch size 256, AdamW optimizer (lr=1e-4, weight decay=1e-5)
Evaluation Metrics
Clustering Metrics (against 25 tissue annotations):
- AMI/NMI (Adjusted/Normalized Mutual Information): Agreement with annotations
- ARI (Adjusted Rand Index): Similarity between clusterings
- Silhouette Score: Internal cluster quality
Spatial Metrics:
- Moran's I: Global spatial autocorrelation (higher = stronger spatial coherence)
- Geary's C: Alternative spatial metric (lower = stronger coherence)
Results
Clustering Visualizations by Backbone
The spatial clustering results show distinct patterns across GNN backbones and SSL methods:
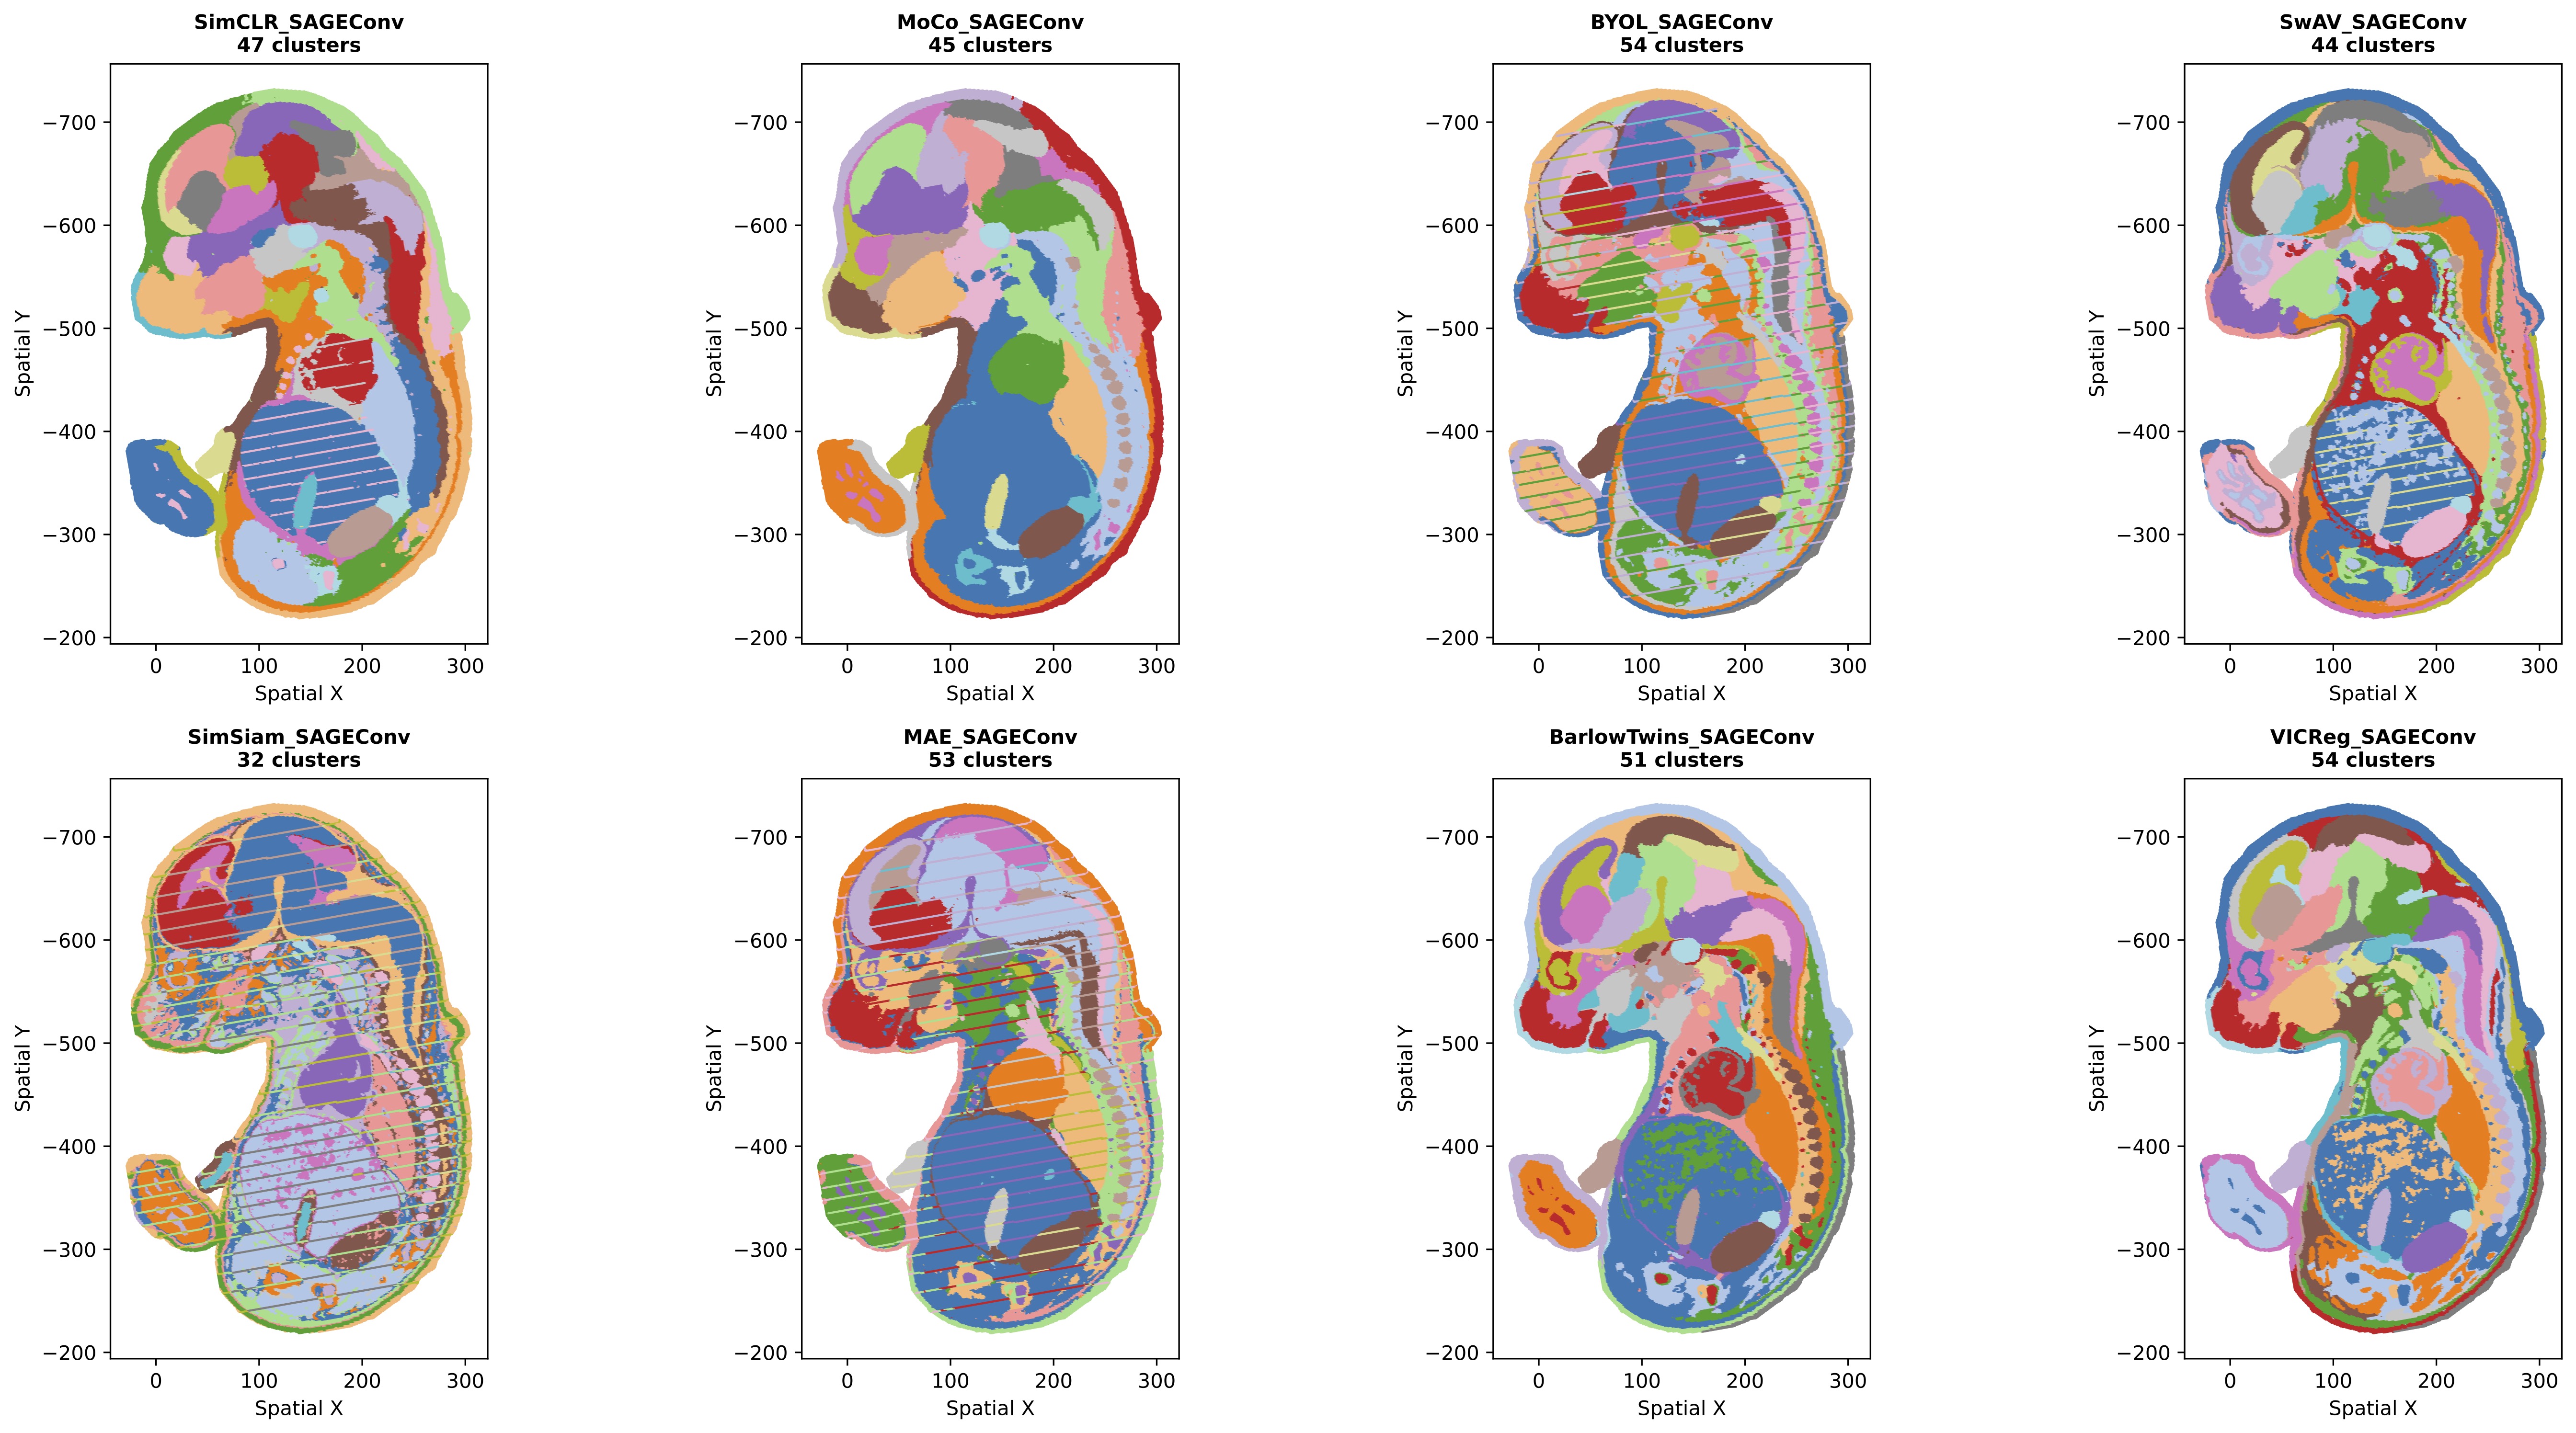 Figure 1: Leiden clustering results for all SSL methods using SAGEConv backbone.
 Figure 2: Leiden clustering results for all SSL methods using GATConv backbone.
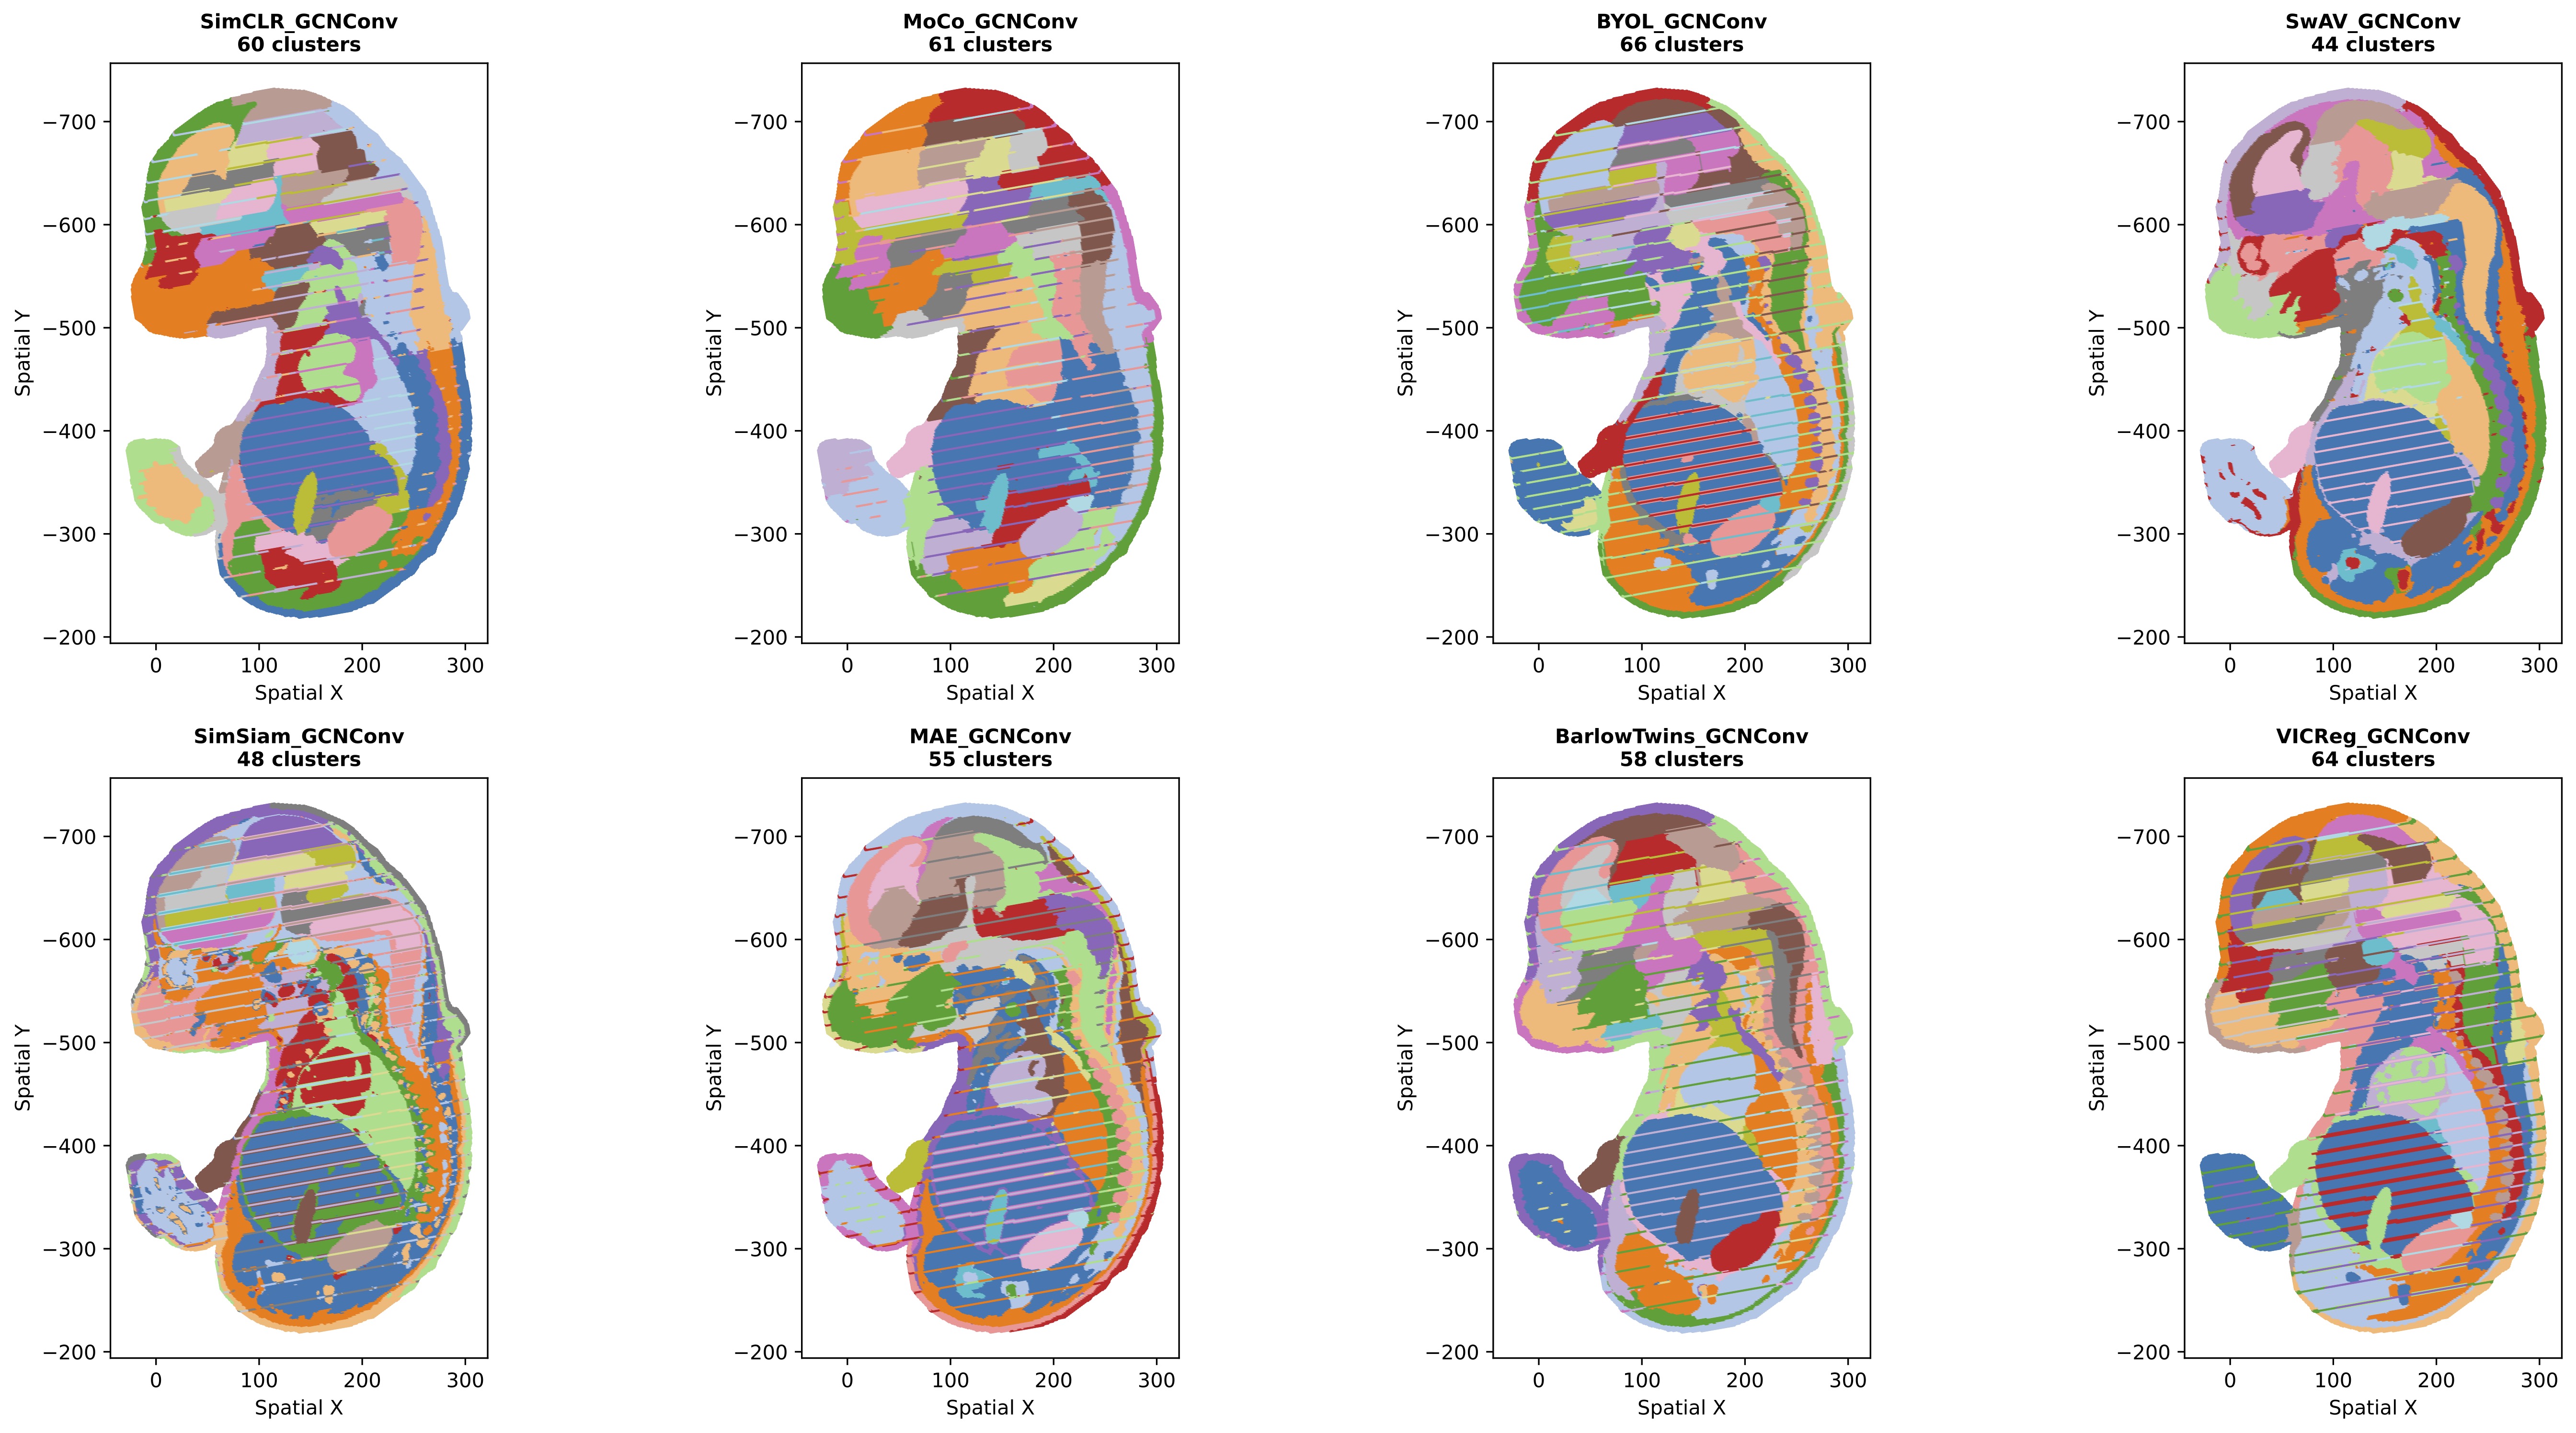 Figure 3: Leiden clustering results for all SSL methods using GCNConv backbone.
Note: Some linear artifacts visible in plots are due to visualization rendering and do not reflect actual data structure.
Qualitative Observations:
- SAGEConv methods show sharp tissue boundaries with preserved local heterogeneity
- GATConv methods exhibit balanced spatial coherence with attention-weighted aggregation
- GCNConv methods demonstrate smoother boundaries but potential over-smoothing in complex regions
- MAE consistently produces spatially coherent clusters across all backbones
- Contrastive methods (SimCLR, MoCo) show more fragmented patterns, particularly with SAGEConv
Quantitative Performance Metrics
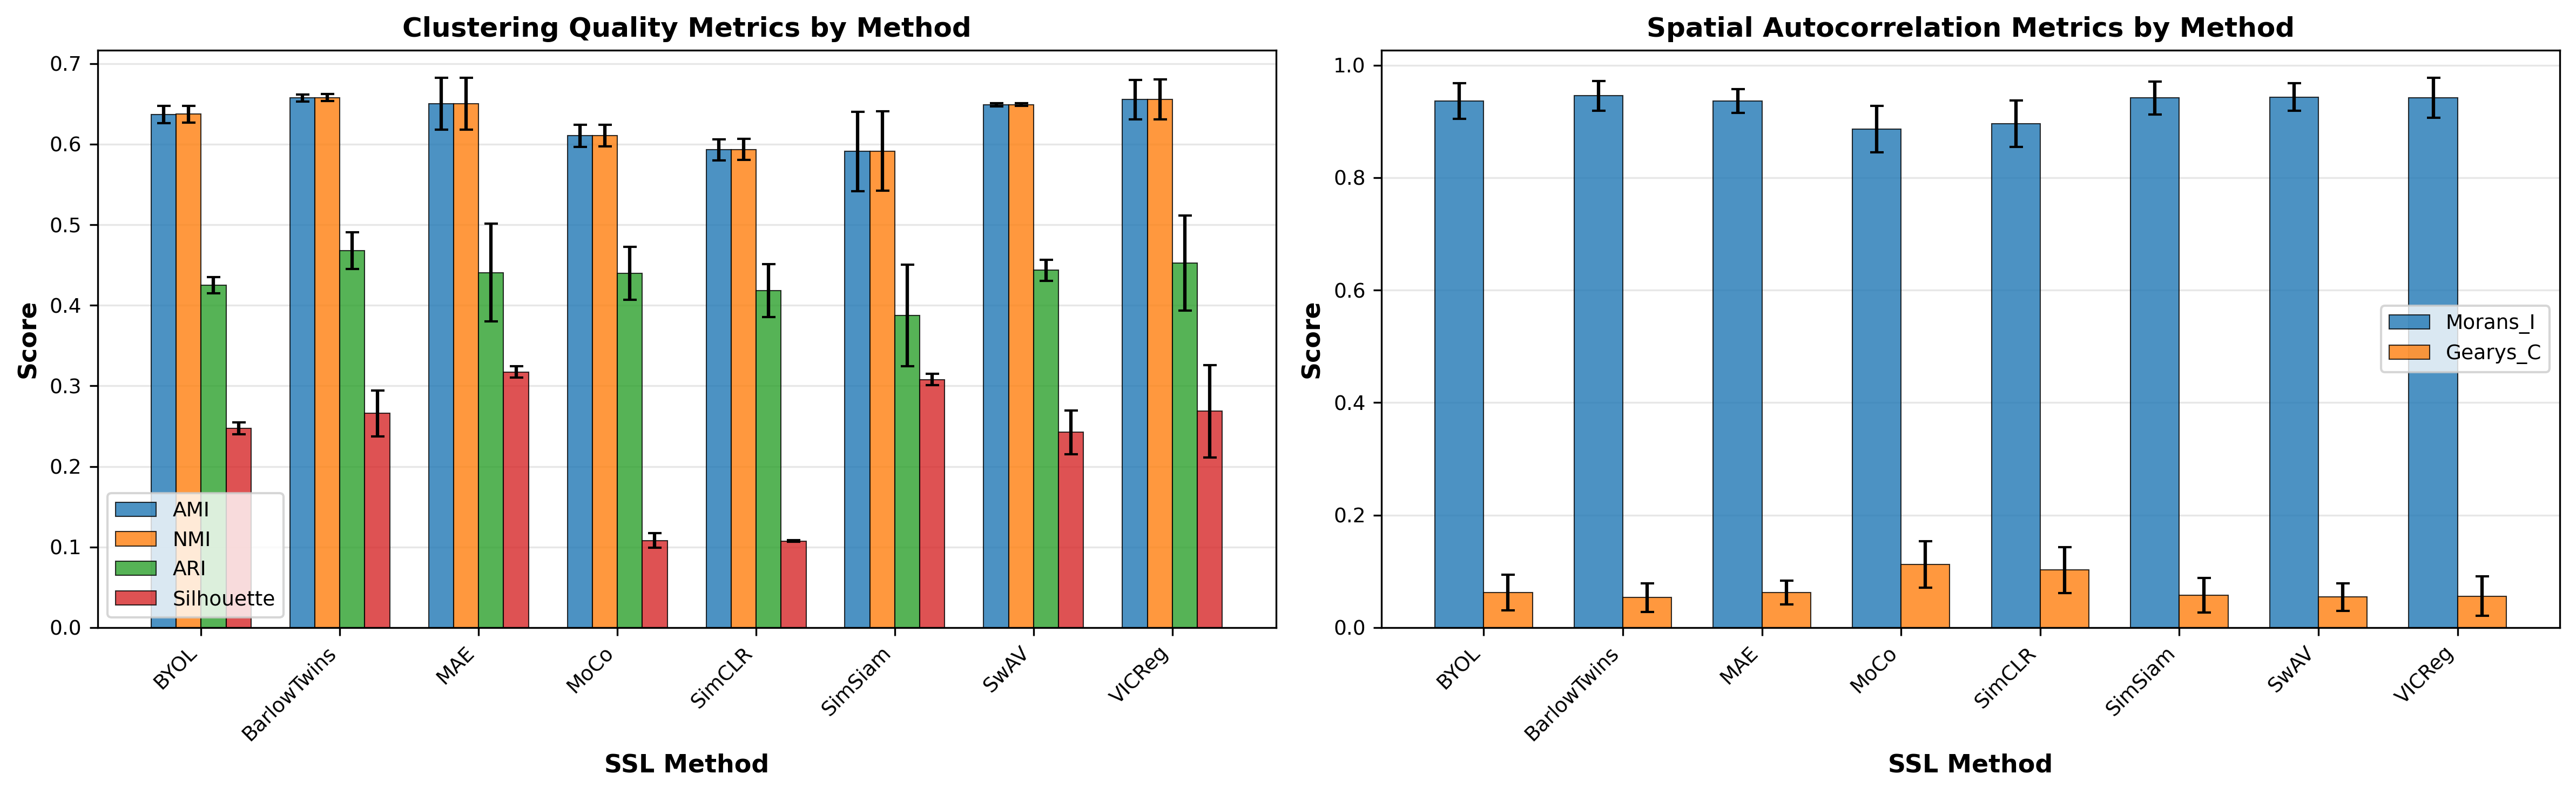 Figure 4: Average performance by SSL method across all GNN backbones. Error bars show standard deviation across the three backbone architectures.
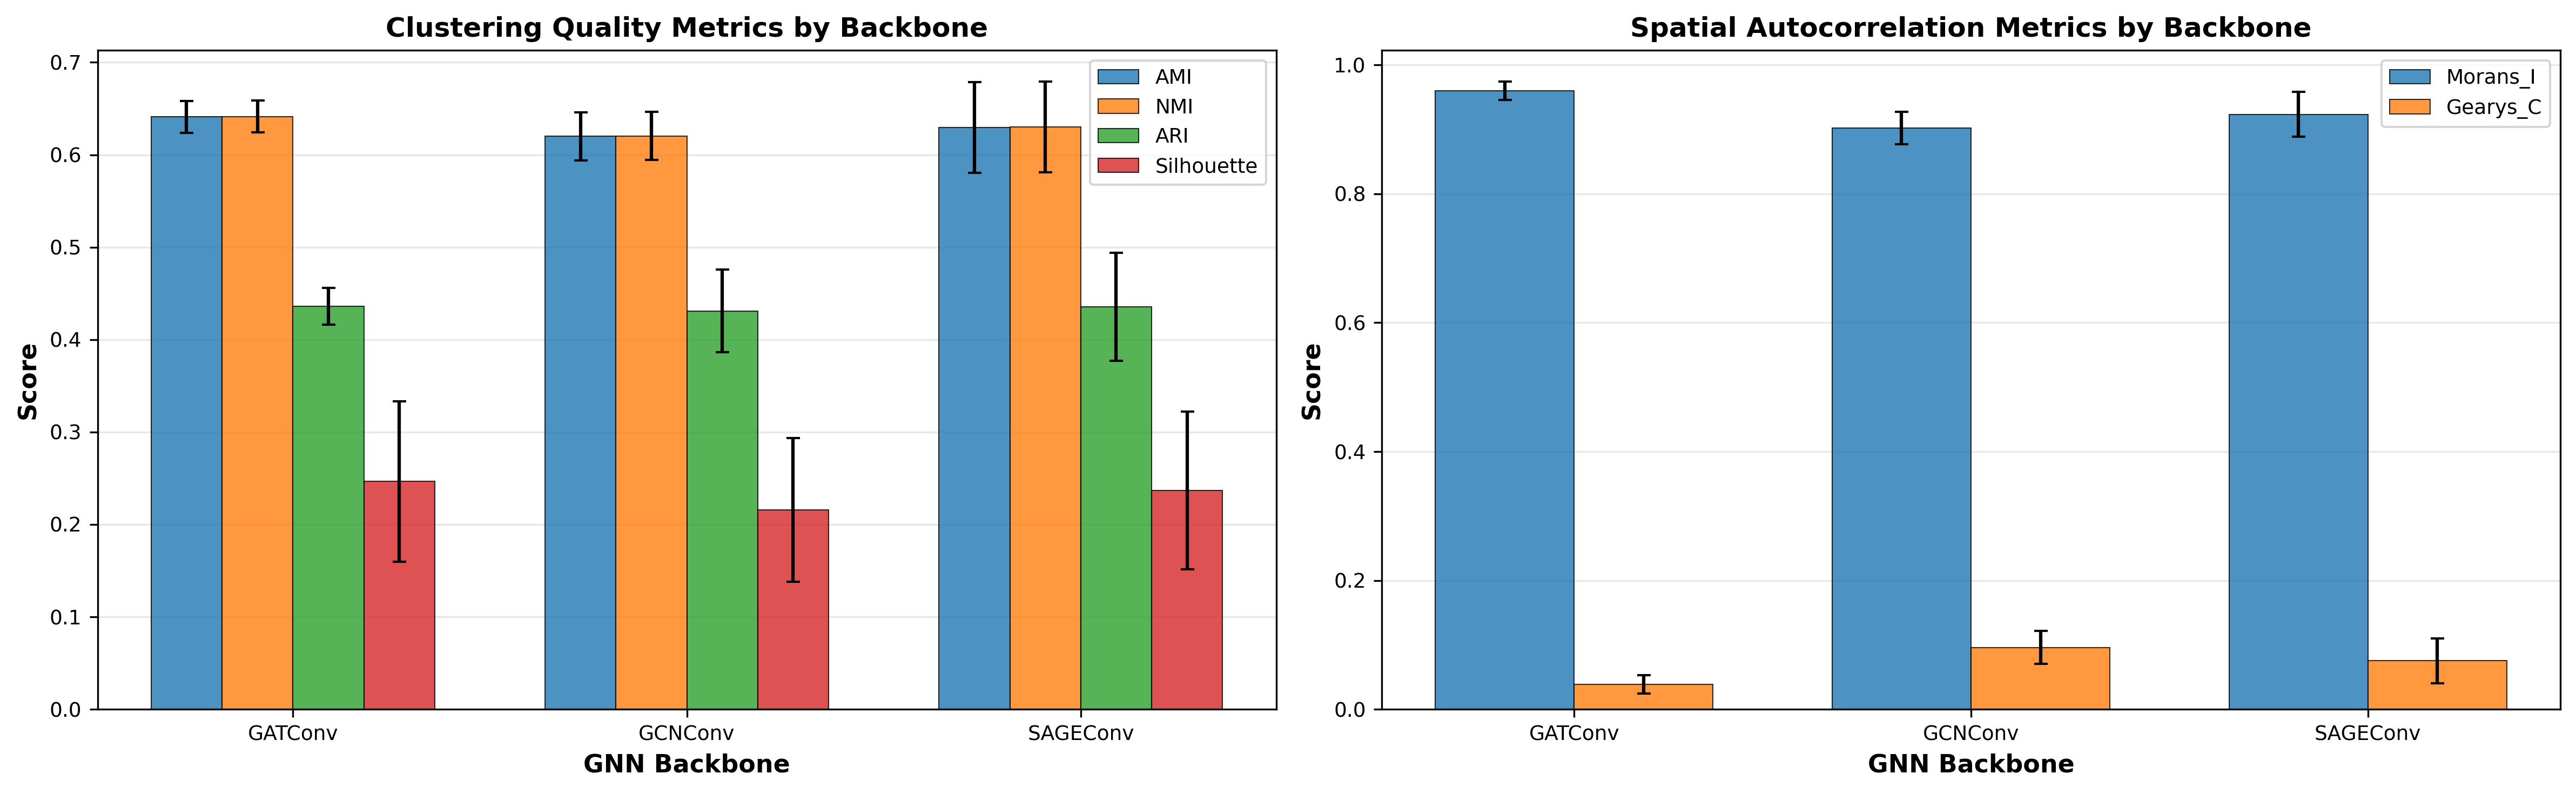 Figure 5: Average performance by GNN backbone across all SSL methods. Error bars show standard deviation across the eight SSL methods.
Method Performance Summary
Average behavior across all three GNN backbones (mean ± std):
| Method | AMI | NMI | ARI | Silhouette | Moran's I | Geary's C |
|---|---|---|---|---|---|---|
| VICReg | 0.655±0.025 | 0.656±0.025 | 0.452±0.059 | 0.269±0.057 | 0.942±0.036 | 0.056±0.035 |
| BarlowTwins | 0.657±0.004 | 0.658±0.004 | 0.468±0.023 | 0.266±0.028 | 0.945±0.027 | 0.053±0.025 |
| MAE | 0.650±0.032 | 0.650±0.032 | 0.441±0.061 | 0.317±0.007 | 0.936±0.021 | 0.062±0.021 |
| SwAV | 0.649±0.002 | 0.649±0.002 | 0.443±0.013 | 0.243±0.027 | 0.944±0.025 | 0.054±0.024 |
| BYOL | 0.637±0.011 | 0.637±0.011 | 0.425±0.010 | 0.247±0.007 | 0.936±0.032 | 0.062±0.032 |
| MoCo | 0.610±0.014 | 0.611±0.014 | 0.440±0.033 | 0.108±0.009 | 0.886±0.041 | 0.112±0.041 |
| SimCLR | 0.593±0.013 | 0.593±0.013 | 0.418±0.033 | 0.107±0.001 | 0.896±0.041 | 0.102±0.041 |
| SimSiam | 0.591±0.049 | 0.591±0.049 | 0.387±0.063 | 0.308±0.007 | 0.942±0.029 | 0.058±0.031 |
Metric Relationships
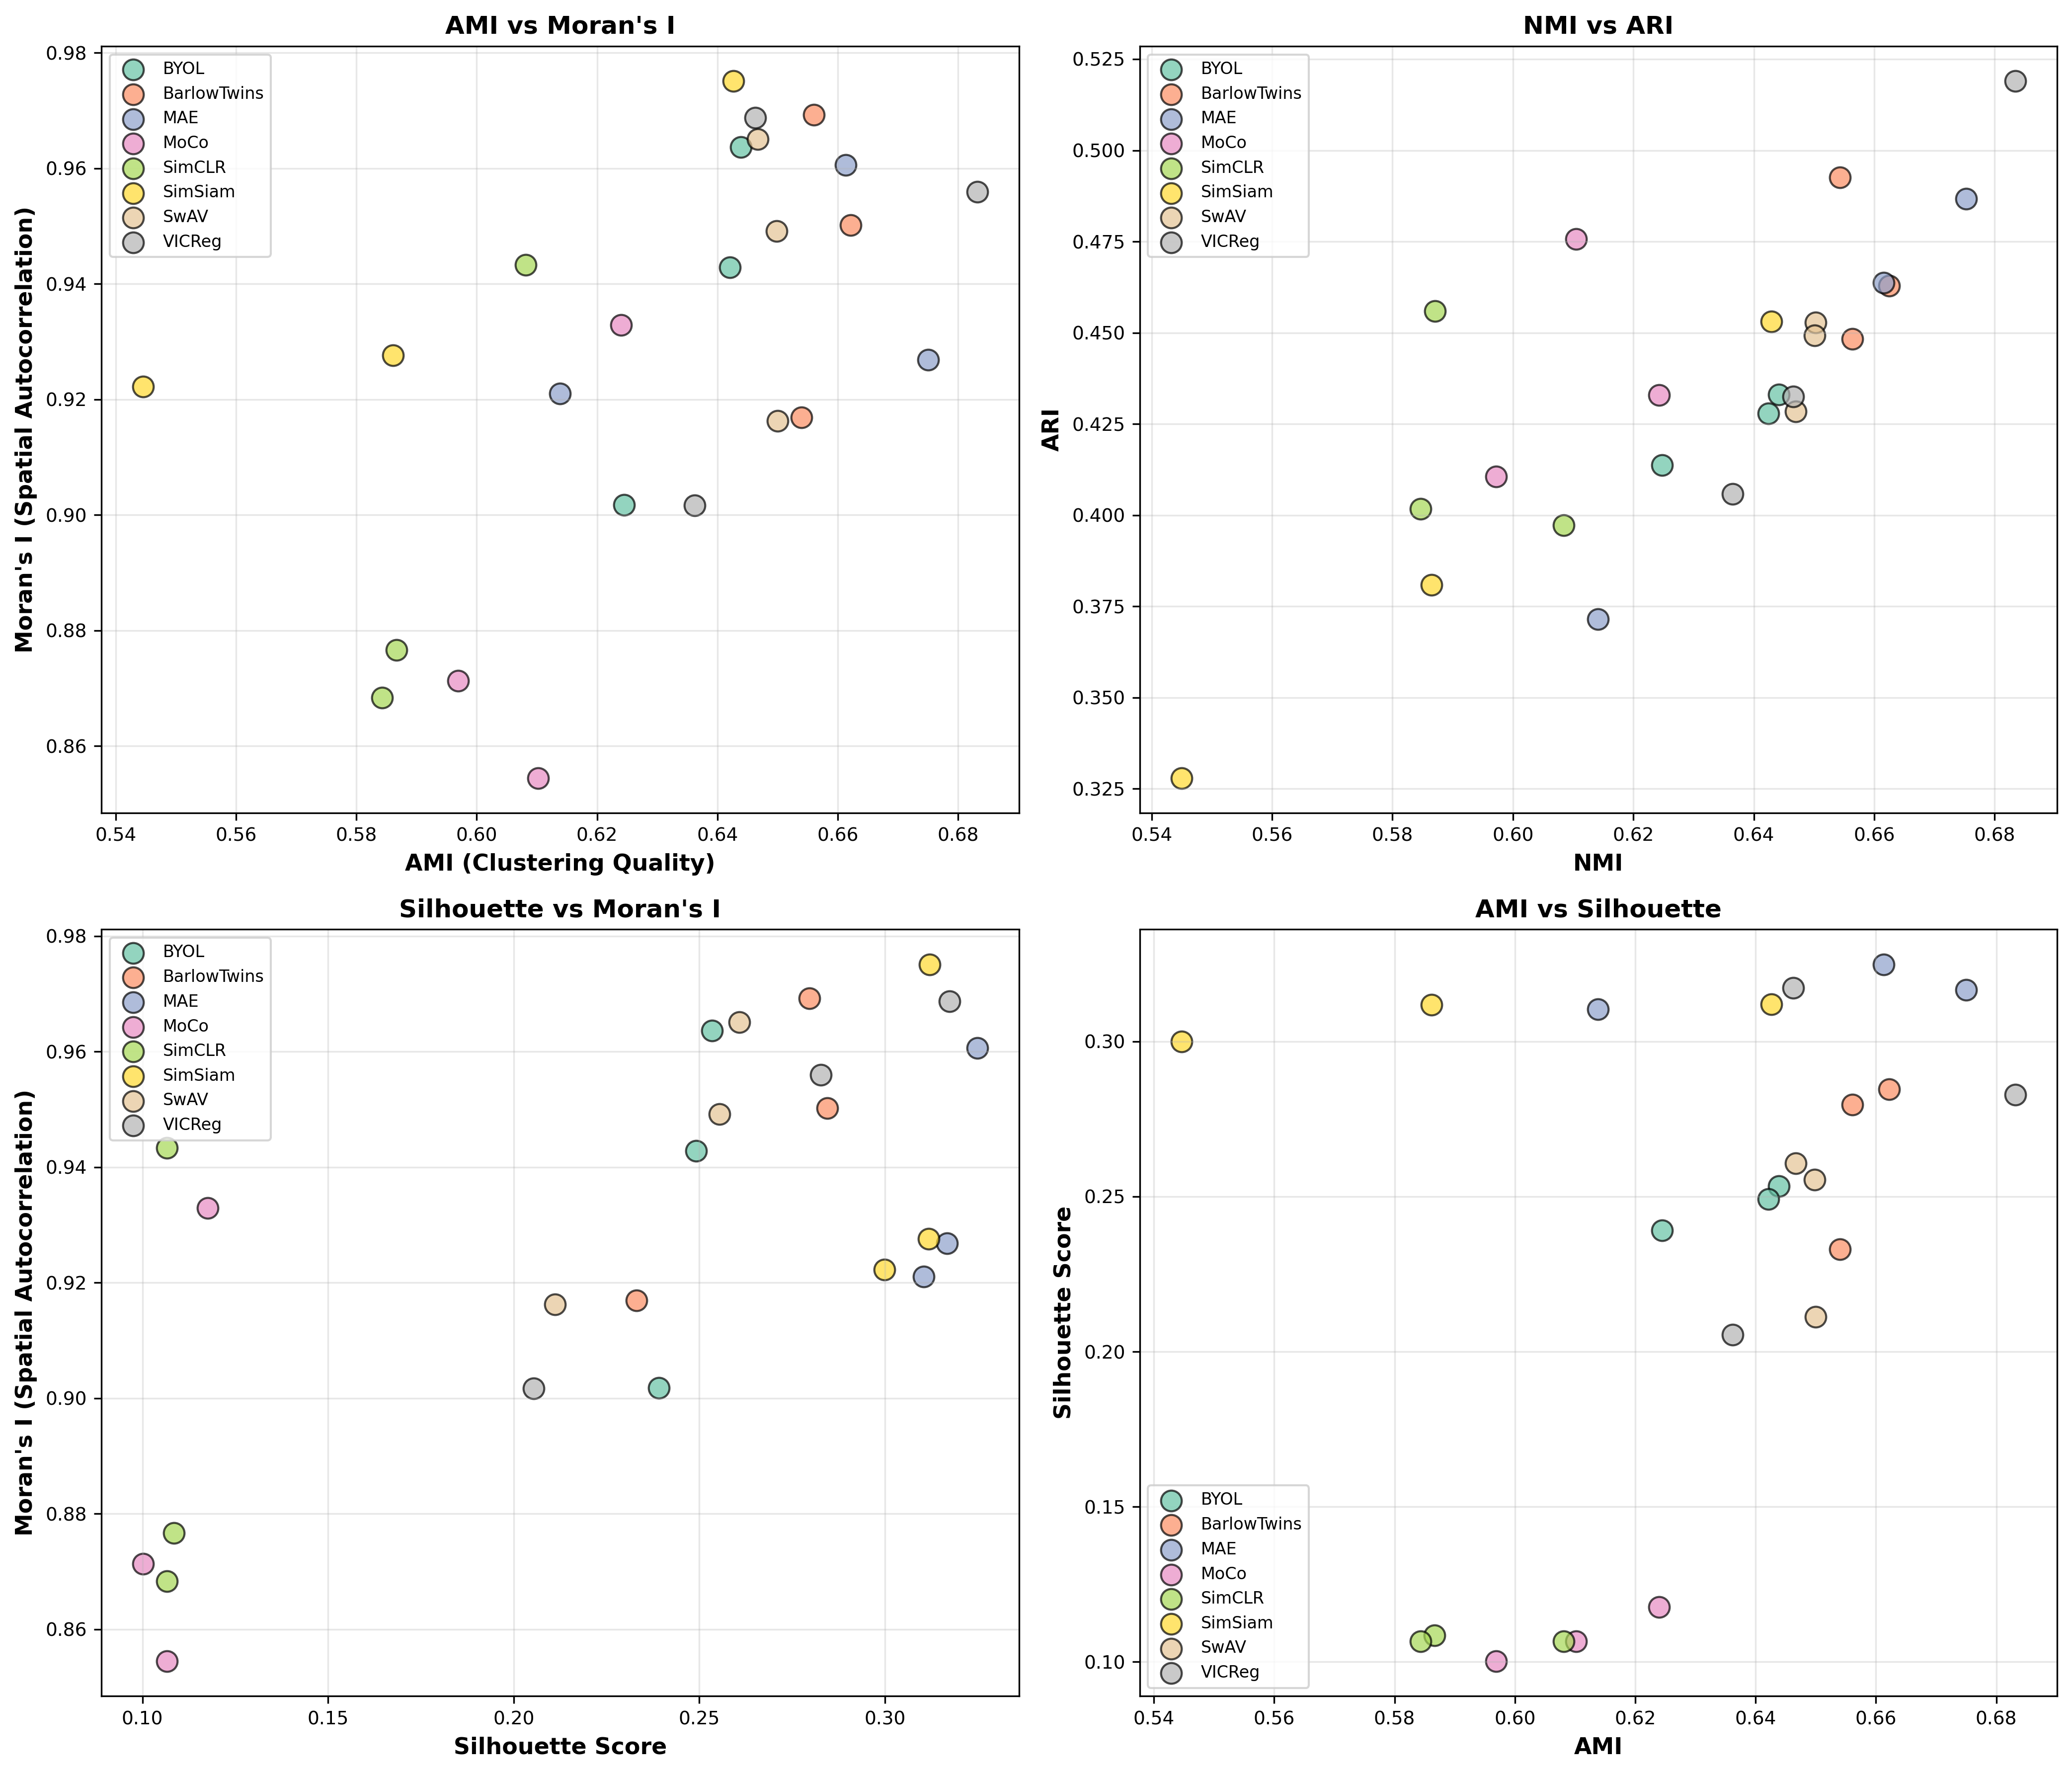 Figure 6: Relationships between different evaluation metrics. Strong positive correlation between AMI and Moran's I (ρ≈0.82) suggests methods that align well with tissue annotations also preserve spatial structure.
Key Findings
1. Reconstruction-Based Approaches Excel at Scale
MAE's Surprising Performance: Unlike in the SiT study where MAE showed high silhouette scores but low clustering agreement (AMI=0.256), leaving the clustering quite noisy. MAE now achieves:
- Competitive AMI (0.650±0.032), ranking 3rd among methods
- Highest silhouette scores (0.317±0.007), indicating excellent internal cluster quality
- Strong spatial coherence (Moran's I=0.936)
- 2nd highest overall score when paired with GATConv
Possible Explanations for Improved MAE Performance:
-
Scale Effects: With 121,767 spots vs. 2,560, the reconstruction task has substantially more signal to denoise
- Larger context neighborhoods provide more robust masking/reconstruction signals
- Averaging effects reduce the impact of stochastic noise in gene expression
-
Multi-Organ Diversity: 25 tissue types with distinct expression signatures provide stronger reconstruction supervision
- Organ-specific gene programs create clearer reconstruction targets
- Developmental coherence (E16.5 embryo) ensures biological consistency
-
Improved Noise Robustness: Large sample size allows the model to learn true signal vs. technical noise
- MAE's denoising objective becomes more effective with statistical power
- Over-smoothing less problematic when true biological variation is stronger
2. Redundancy Reduction Methods Maintain Excellence
VICReg and Barlow Twins continue to show top-tier performance:
- VICReg-SAGEConv: Best overall performer (0.915 normalized score)
- Barlow Twins: Most consistent across backbones (std=0.004 for AMI)
- Both methods balance clustering quality, spatial coherence, and internal structure
This consistency across datasets (SiT and MOSTA) suggests redundancy reduction objectives are robust to dataset scale and biological context.
3. Contrastive Methods Show Limitations at Scale
SimCLR and MoCo underperform compared to smaller dataset:
- Lowest AMI scores (0.593, 0.610 respectively)
- Lowest silhouette scores (~0.11), suggesting poor internal cluster quality
- High sensitivity to GNN backbone choice
Potential Issues:
- Hard Negative Sampling: With 25 diverse tissue types, distinguishing true negatives becomes challenging (especially with the small batch size)
- Temperature Sensitivity: Fixed temperature (0.2) may not suit multi-organ diversity
- Queue/Batch Size: MoCo queue (4096) may not capture sufficient diversity
- Augmentation Mismatch: Gene dropout may be too aggressive for preserving tissue-specific signatures
4. Momentum-Based Methods (BYOL) Show Stability
BYOL maintains consistent mid-tier performance:
- Stable across backbones (std=0.011 for AMI)
- Balanced metrics without over-optimizing any single objective
- No collapse issues despite lack of explicit negative pairs
Comparison with SiT Results
Why MAE Performance Improved Dramatically
The MAE paradox from SiT (high silhouette, low AMI) completely reversed in MOSTA:
SiT (Small Dataset):
- Reconstruction task may have learned technical noise
- Limited biological variation for denoising supervision
- Over-smoothed local brain region heterogeneity
MOSTA (Large Dataset):
- Sufficient samples to separate signal from noise
- Multi-organ diversity provides strong reconstruction signals
- Embryonic developmental coherence aids structured learning
Implication: Reconstruction-based SSL may be highly scale-dependent, requiring sufficient data to avoid overfitting to noise.
Consistency Across Datasets
Methods showing robust behavior:
- Barlow Twins: Top performer in both datasets (low variance, high AMI)
- VICReg: Consistently excellent, especially with SAGEConv
- BYOL: Stable mid-tier performer regardless of scale
Methods sensitive to dataset characteristics:
- MAE: Excellent on large/diverse data, poor on small/homogeneous data
- SimCLR/MoCo: Struggle with increased complexity
- SimSiam: High variance across datasets
Future Directions
Critical Next Steps
1. Over-Smoothing Mitigation
GCNConv's poor performance highlights the need for advanced architectures:
- Global Spatial Attention: Allow long-range dependencies beyond local neighborhoods
- Preliminary experiments with regional attention showed significant GAT improvements
- Positional encodings based on developmental axes (anterior-posterior, dorsal-ventral)
- Skip Connections: Direct feature pathways to preserve local information
- Adaptive Aggregation: Learn when to aggregate vs. preserve local features
- Graph Rewiring: Dynamic edge updates based on learned feature similarity
2. Hyperparameter Optimization
Current parameters are only lightly tuned, leaving substantial room for improvement.
3. Better Evaluation Metrics
Current metrics have limitations:
Issues with AMI/NMI:
- Assume 25 annotations are ground truth (may be incomplete/subjective)
- Don't capture biological interpretability
- Biased toward majority classes (Brain: 17,374 spots vs. Adrenal: 194 spots)
Proposed Alternatives:
- Gene Set Enrichment: Do clusters enrich for known biological pathways?
- Marker Gene Recovery: Can learned representations recover known tissue markers?
- Batch Effect Resilience: Performance across multiple tissue sections/samples
- Transferability: Fine-tuning efficiency on downstream tasks
- Biological Coherence: Consistency with known developmental biology
4. Graph Construction Beyond k-NN
Current approach is purely geometric:
- Biological Graphs: Edges based on gene expression similarity + spatial proximity
- Multi-modal Graphs: Integrate protein/morphology if available
- Hierarchical Graphs: Multiple scales (local neighborhoods + tissue-level regions)
- Developmental Axes: Incorporate A-P, D-V, L-R axes for embryonic data
5. Novel Finding Discovery
Contrastive methods learn discriminative features that may not align with current annotations:
- Unsupervised Discovery: What novel patterns do SimCLR/MoCo learn?
- Transitional Zones: Boundary regions between annotated tissues
- Rare Cellular States: Sub-populations not captured in broad annotations
- Validation Strategy: Compare with single-cell RNA-seq references, known developmental markers
Open Questions
-
Can embeddings from different methods be combined?
- Ensemble approaches: average embeddings, late fusion, meta-learning
- Leverage complementary strengths (MAE's denoising + VICReg's structure)
-
Gene-centric vs. Spot-centric Learning:
- Current: Each spot is a sample (spatial context)
- Alternative: Each gene is a sample (co-expression patterns across space)
- Which perspective better captures biological programs?
Acknowledgments
This analysis leveraged:
- MOSTA dataset
- PyTorch Geometric for scalable GNN implementations
- Scanpy for preprocessing and visualization
- Scikit-learn for evaluation metrics
- Previous framework established in SiT exploration
References
SSL Methods:
- Chen et al. (2020) - SimCLR: A Simple Framework for Contrastive Learning
- He et al. (2020) - MoCo: Momentum Contrast for Unsupervised Visual Representation Learning
- Grill et al. (2020) - BYOL: Bootstrap Your Own Latent
- Caron et al. (2020) - SwAV: Unsupervised Learning of Visual Features by Contrasting Cluster Assignments
- Chen & He (2021) - SimSiam: Exploring Simple Siamese Representation Learning
- He et al. (2022) - MAE: Masked Autoencoders Are Scalable Vision Learners
- Zbontar et al. (2021) - Barlow Twins: Self-Supervised Learning via Redundancy Reduction
- Bardes et al. (2022) - VICReg: Variance-Invariance-Covariance Regularization
GNN Architectures:
- Hamilton et al. (2017) - GraphSAGE: Inductive Representation Learning on Large Graphs
- Veličković et al. (2018) - GAT: Graph Attention Networks
- Kipf & Welling (2017) - GCN: Semi-Supervised Classification with Graph Convolutional Networks