Can AlphaGenome Predict TWAS Variant Effects in Atrial Fibrillation?
Evaluating AlphaGenome's pre-computed variant effect scores against TWAS associations across 10 GTEx tissues reveals weak but real directional signal, chromatin-driven fine-mapping enrichment, and fundamental limits of sequence-based expression prediction
Tech Stack
Tags
Can AlphaGenome Predict TWAS Variant Effects in Atrial Fibrillation?
TWAS identifies genes whose genetically predicted expression associates with disease. GWAS identifies trait-associated variants. But neither reveals the molecular mechanism connecting variant to gene to phenotype. Deep learning genomic models like AlphaGenome predict variant effects on expression and chromatin from sequence alone, potentially bridging this gap.
This study asks whether AlphaGenome's variant effect predictions agree with — and can explain — TWAS associations for atrial fibrillation (AF), a well-powered cardiac trait with 858 significant gene-tissue pairs across 10 GTEx tissues and 418 unique genes.
Table of Contents
- Data Integration Pipeline
- Q1: Sign Concordance
- Q2: Fine-Mapping Enrichment
- Q3: Tissue Specificity
- Q4: Quantitative Agreement
- Putting It in Context
- Conclusions
Data Integration Pipeline
Four layers of genetic evidence were assembled per variant:
GWAS Z-score  →  fine-mapped PIP (SuSiE)  →  AlphaGenome score  →  TWAS Z-score
  (variant)         (causal probability)        (molecular effect)     (gene-level)
- GWAS: AF summary statistics (N ~ 1M), rsIDs mapped to hg38 via dbSNP v151 (99.7% coverage), Z-scores oriented to ALT allele
- TWAS: FUSION results across 10 GTEx v8 tissues, 858 gene-tissue pairs at genome-wide significance (P < 4.7x10^-6)
- Fine-mapping: SuSiE per gene-tissue pair, retaining variants in 95% credible sets or PIP > 0.01 — yielding 10,120 variant-gene-tissue triplets
- AlphaGenome:
score_variantAPI returning variant effect scores across ~3,800 biosamples in 19 output blocks, from which we extracted RNA-seq (gene-level), ATAC-seq, DNase-seq, and CAGE features
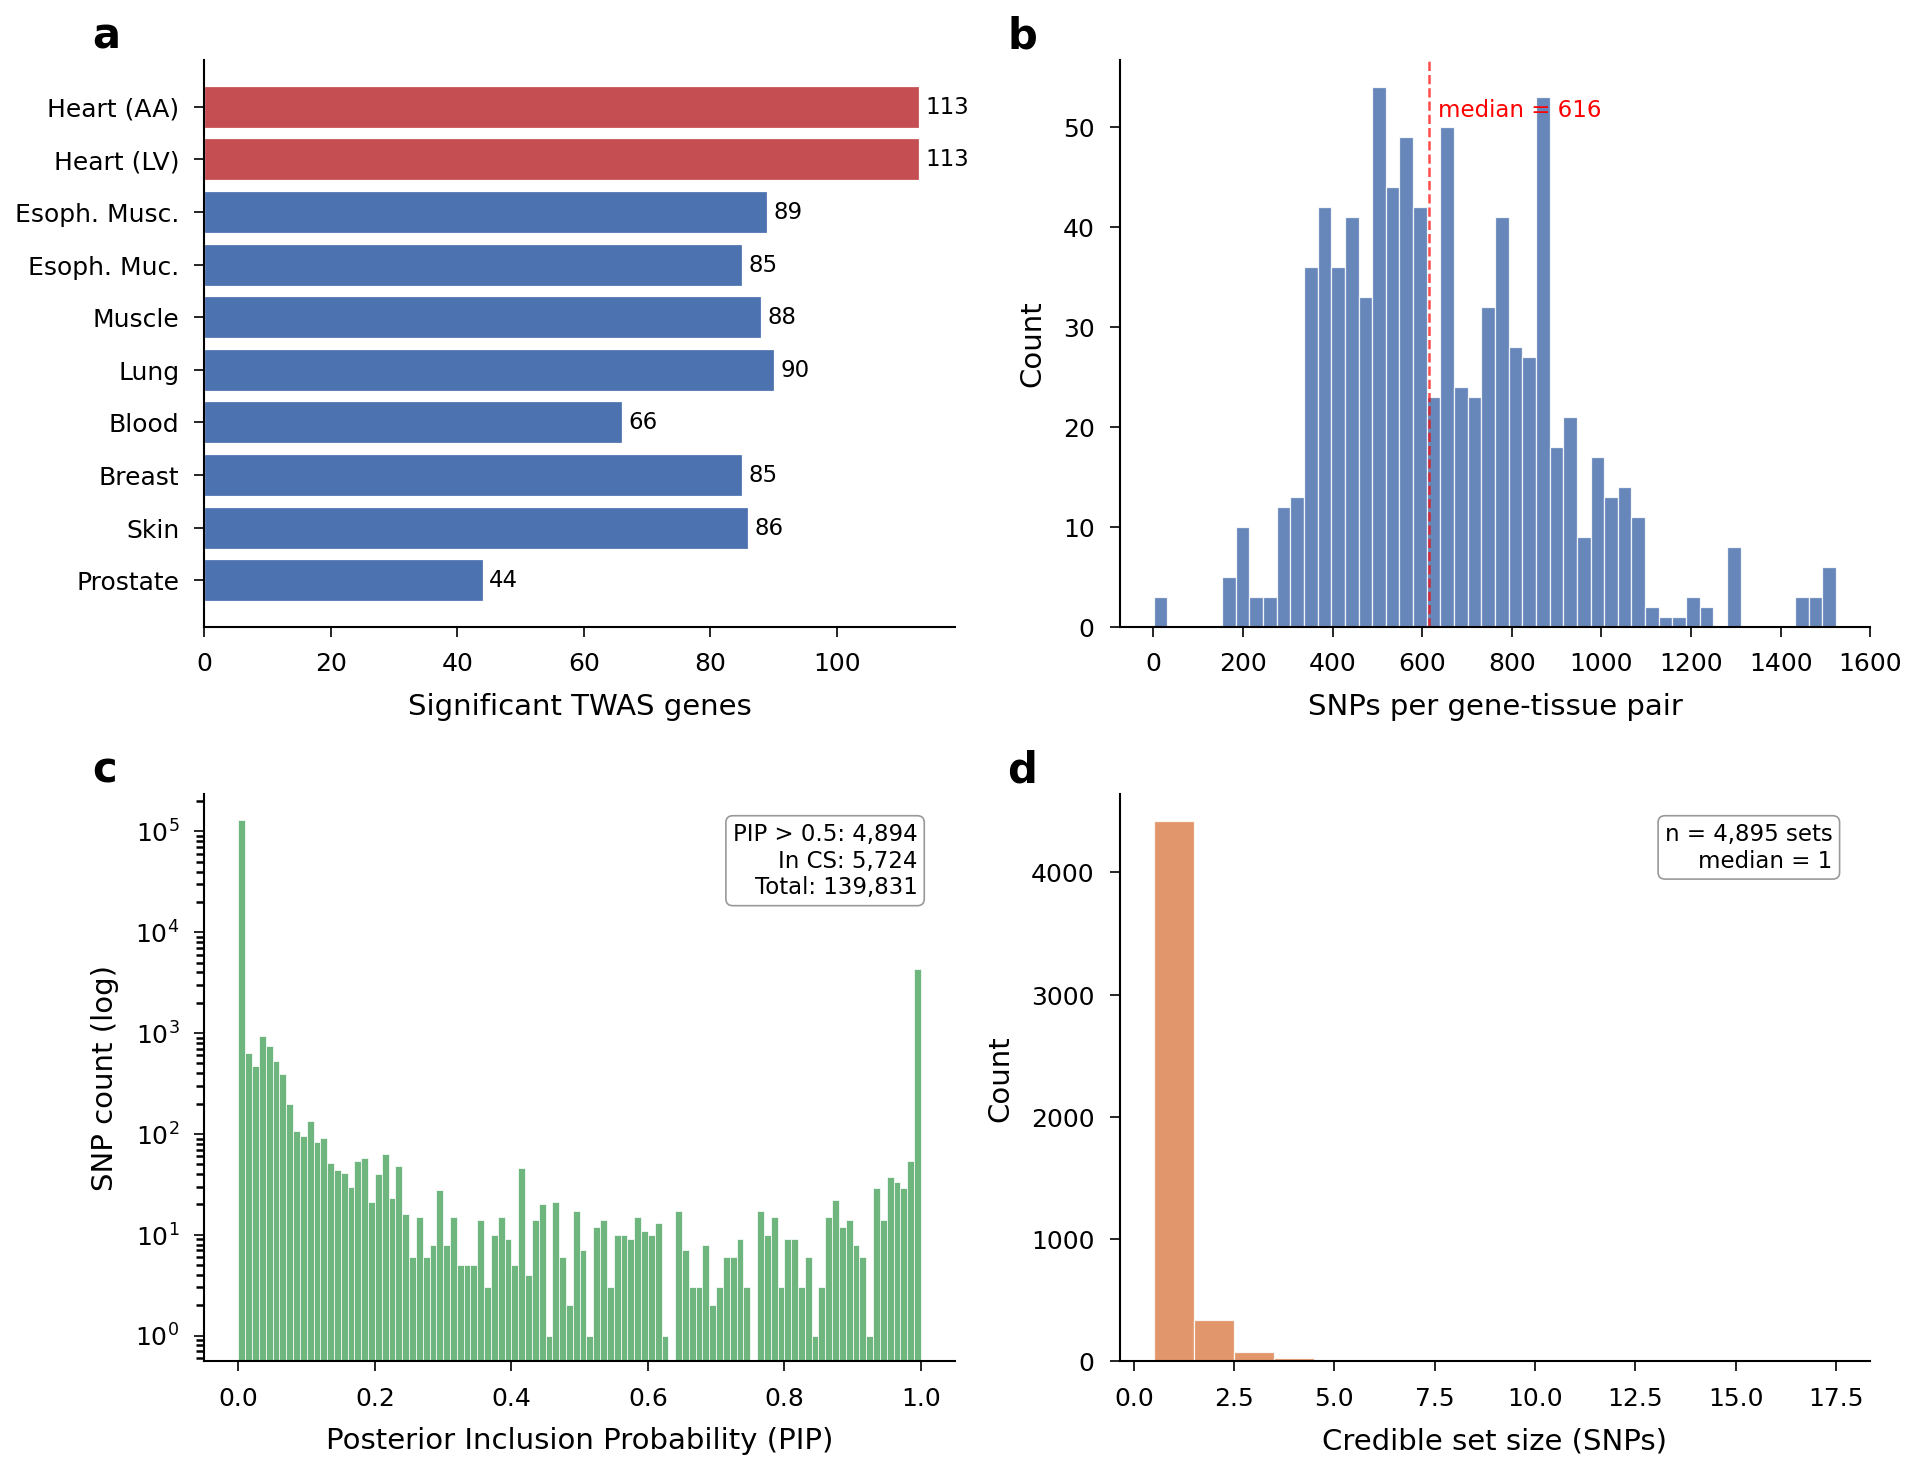 Overview of the dataset: genes per tissue, SNPs per gene, PIP distributions, and credible set sizes.
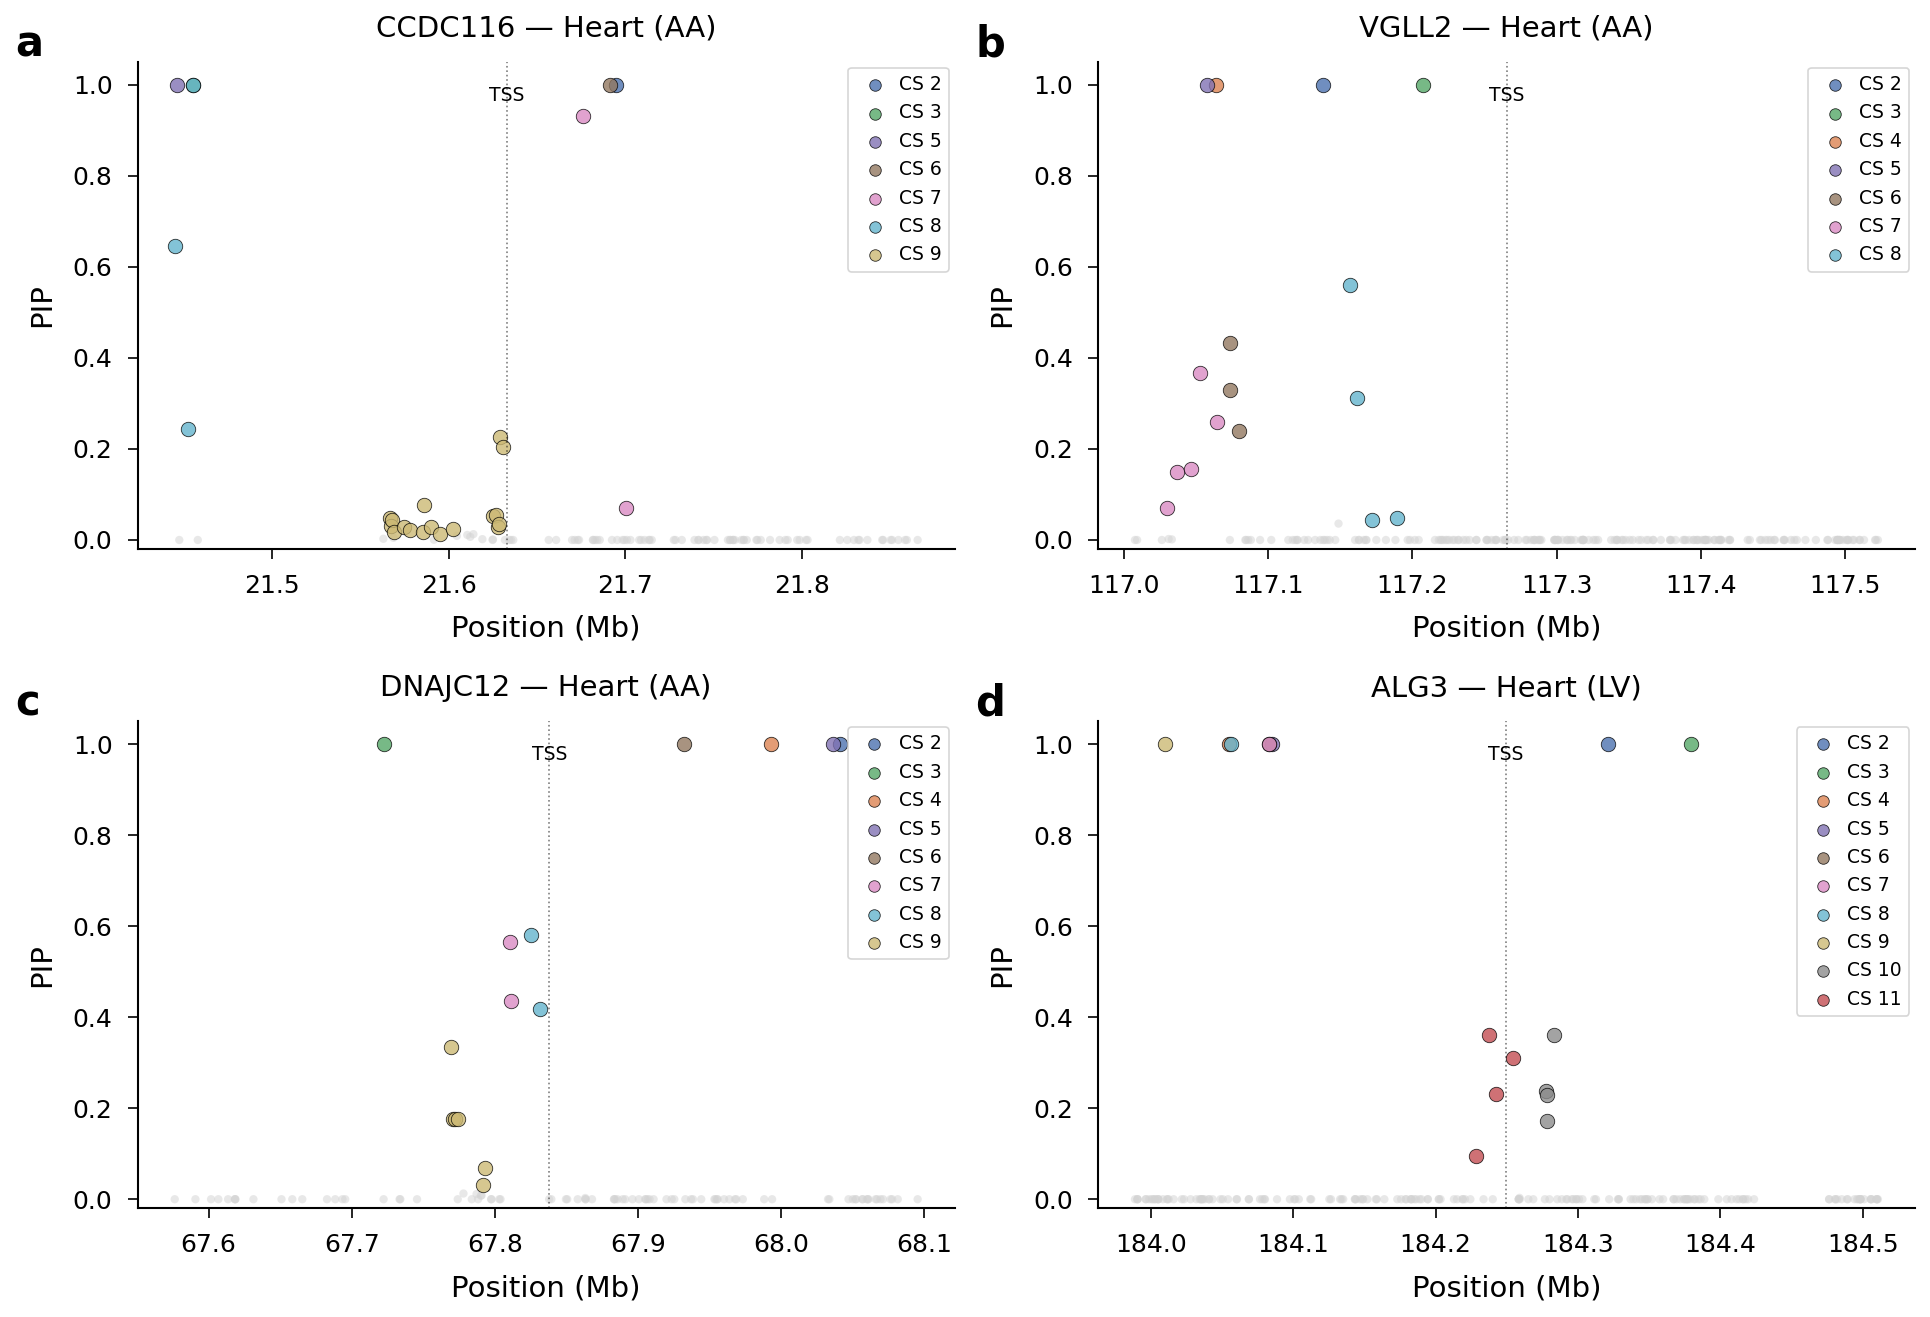 SuSiE PIP Manhattan plots for key AF loci including PITX2, TBX5, SCN5A/10A, and KCNN3.
Q1: Do AlphaGenome Scores Agree in Direction with TWAS Effects?
Motivation
If a variant increases AF risk (positive GWAS Z) and upregulates a gene (positive TWAS Z), then the mediation model predicts AlphaGenome should predict a positive expression effect: sign(AG score) = sign(GWAS_Z x TWAS_Z). Testing this across all 10,120 triplets tells us whether AlphaGenome captures the direction of variant-to-expression effects.
Methods
For each variant, we computed unweighted and PIP-weighted sign concordance under the mediation model, with binomial P-values against the 50% null and 1,000x permutation baselines (shuffling variant-to-score assignments within each gene).
Results
RNA-seq variant effect scores showed statistically significant concordance in five tissues:
| Tissue | Sign accuracy | n SNPs | Binomial P | Permutation P |
|---|---|---|---|---|
| Prostate | 59.8% | 408 | 4.4x10^-5 | 0.013 |
| Whole Blood | 56.2% | 612 | 1.2x10^-3 | 0.139 |
| Esophagus Mucosa | 55.7% | 1,284 | 2.6x10^-5 | 0.076 |
| Skin | 53.6% | 701 | 0.029 | 0.415 |
| Heart LV | 52.5% | 1,621 | 0.023 | 0.424 |
Chromatin assays showed weaker sign concordance overall. The strongest chromatin signal was DNase-seq in Heart AA (52.3%, binomial P = 0.037, permutation P = 0.001) — the only tissue-assay pair where permutation confirmed the signal exceeds what score magnitude alone predicts.
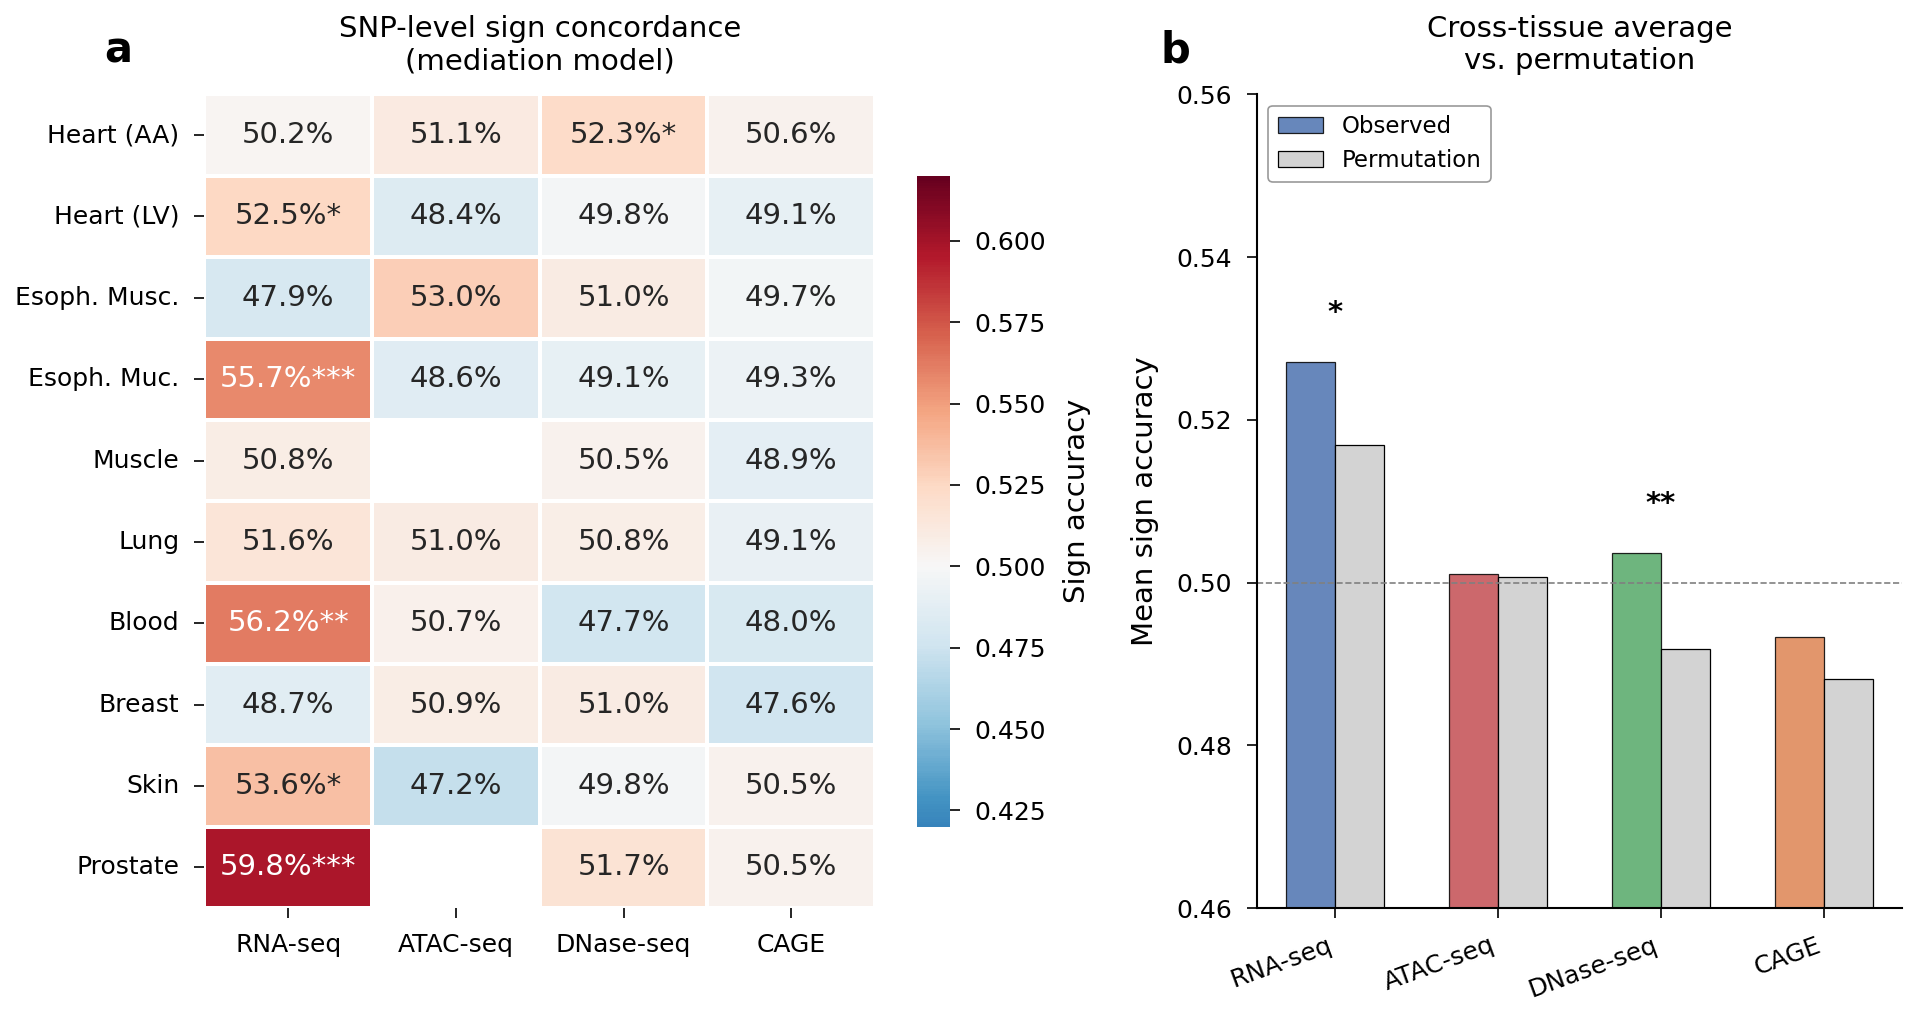 Sign concordance heatmap across tissues and assays, with Heart AA DNase permutation distribution.
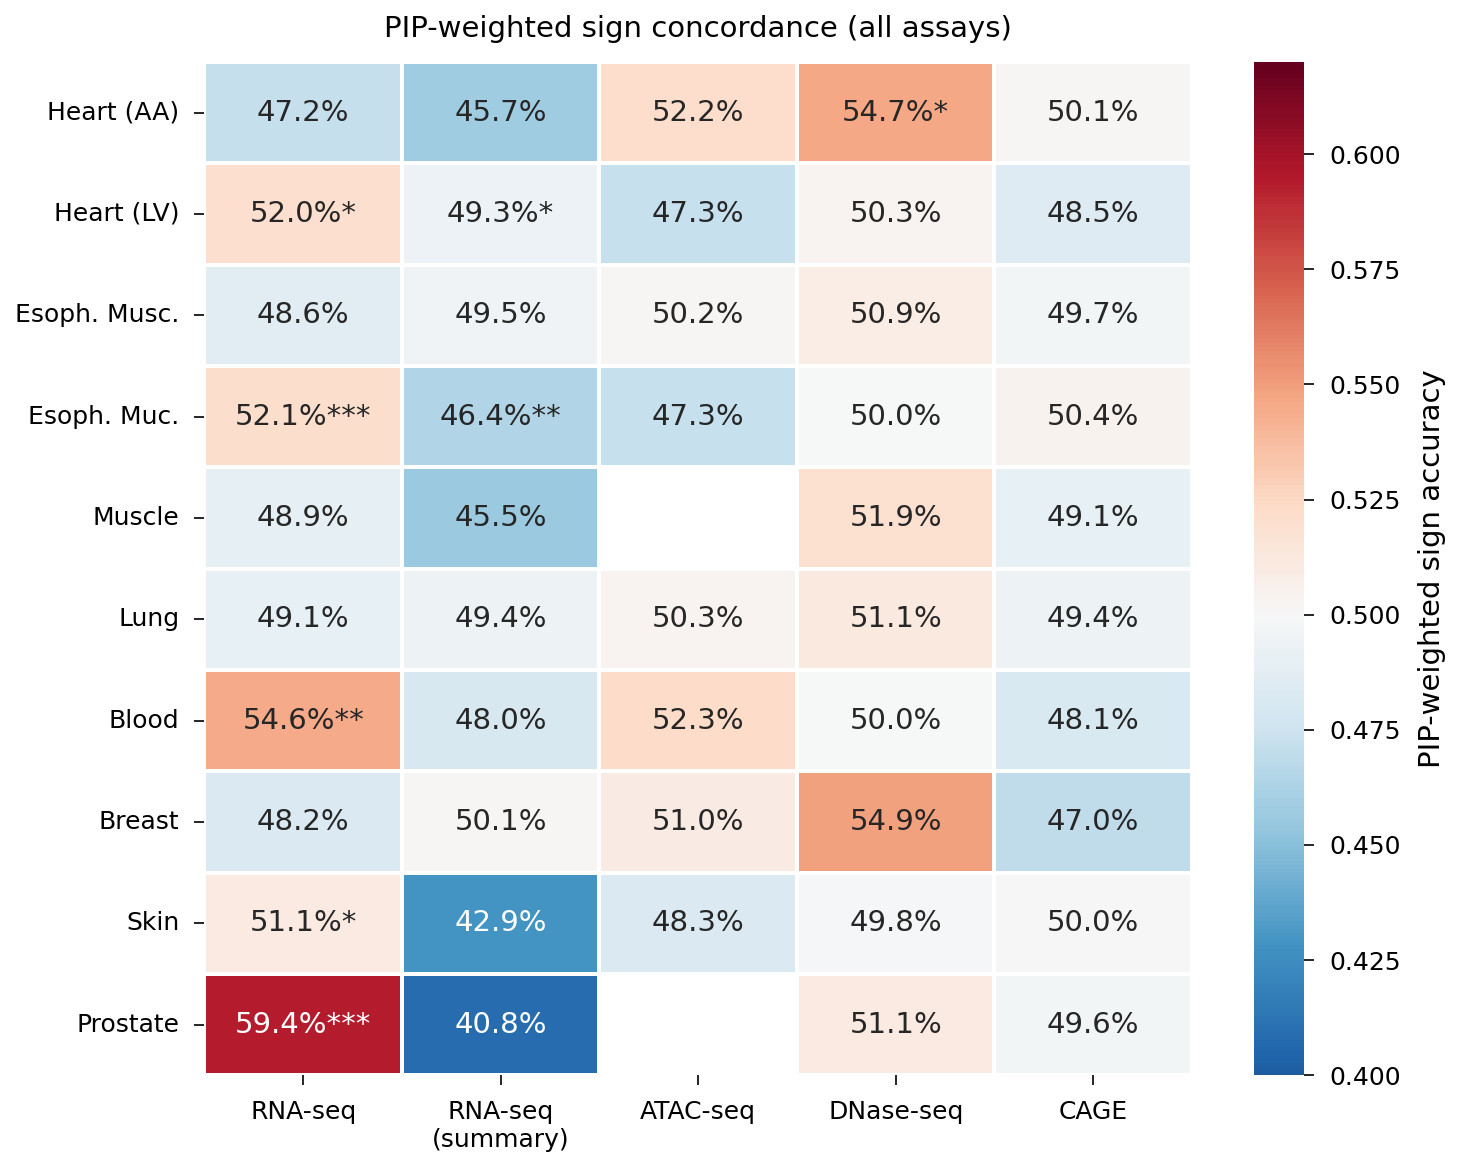 Supplementary: full PIP-weighted sign accuracy grid across all tissue-assay combinations.
Interpretation
AlphaGenome RNA-seq scores encode weak but real directional information — 55-60% accuracy in the best tissues is above chance but far below the 70% target. The signal is modest, consistent with prior literature showing that sequence-based models struggle with variant effect direction even when they identify relevant regulatory variants. Chromatin scores carry directional information primarily for Heart AA DNase, suggesting tissue-matched chromatin may complement expression predictions.
Q2: Can AlphaGenome Distinguish Fine-Mapped Causal Variants?
Motivation
If AlphaGenome captures functional variant effects, then statistically fine-mapped causal variants (SuSiE credible sets) should have larger absolute scores than background variants at the same loci. This tests whether AlphaGenome scores provide orthogonal evidence for variant causality.
Methods
Compared mean |AG score| between credible set variants (CS >= 0) and non-CS variants using Mann-Whitney U tests. Also tested PIP-score correlation across all variants.
Results
Chromatin assays showed significant enrichment in credible sets:
| Assay | CS mean |score| | Non-CS mean | Fold enrichment | P | |-------|-------------------|-----------------|-----------------|---| | ATAC-seq | 0.028 | 0.024 | 1.18x | 2.3x10^-9 | | CAGE | 0.017 | 0.015 | 1.14x | 4.5x10^-8 | | DNase-seq | 0.053 | 0.047 | 1.14x | 8.5x10^-5 | | RNA-seq | 0.0015 | 0.0013 | 1.10x | n.s. |
PIP correlates weakly but significantly with |score| for ATAC (rho = 0.036, P = 6.9x10^-4), DNase (rho = 0.024, P = 0.014), and CAGE (rho = 0.039, P = 9.8x10^-5). RNA-seq showed a paradoxical negative correlation (rho = -0.065, P = 7.4x10^-11).
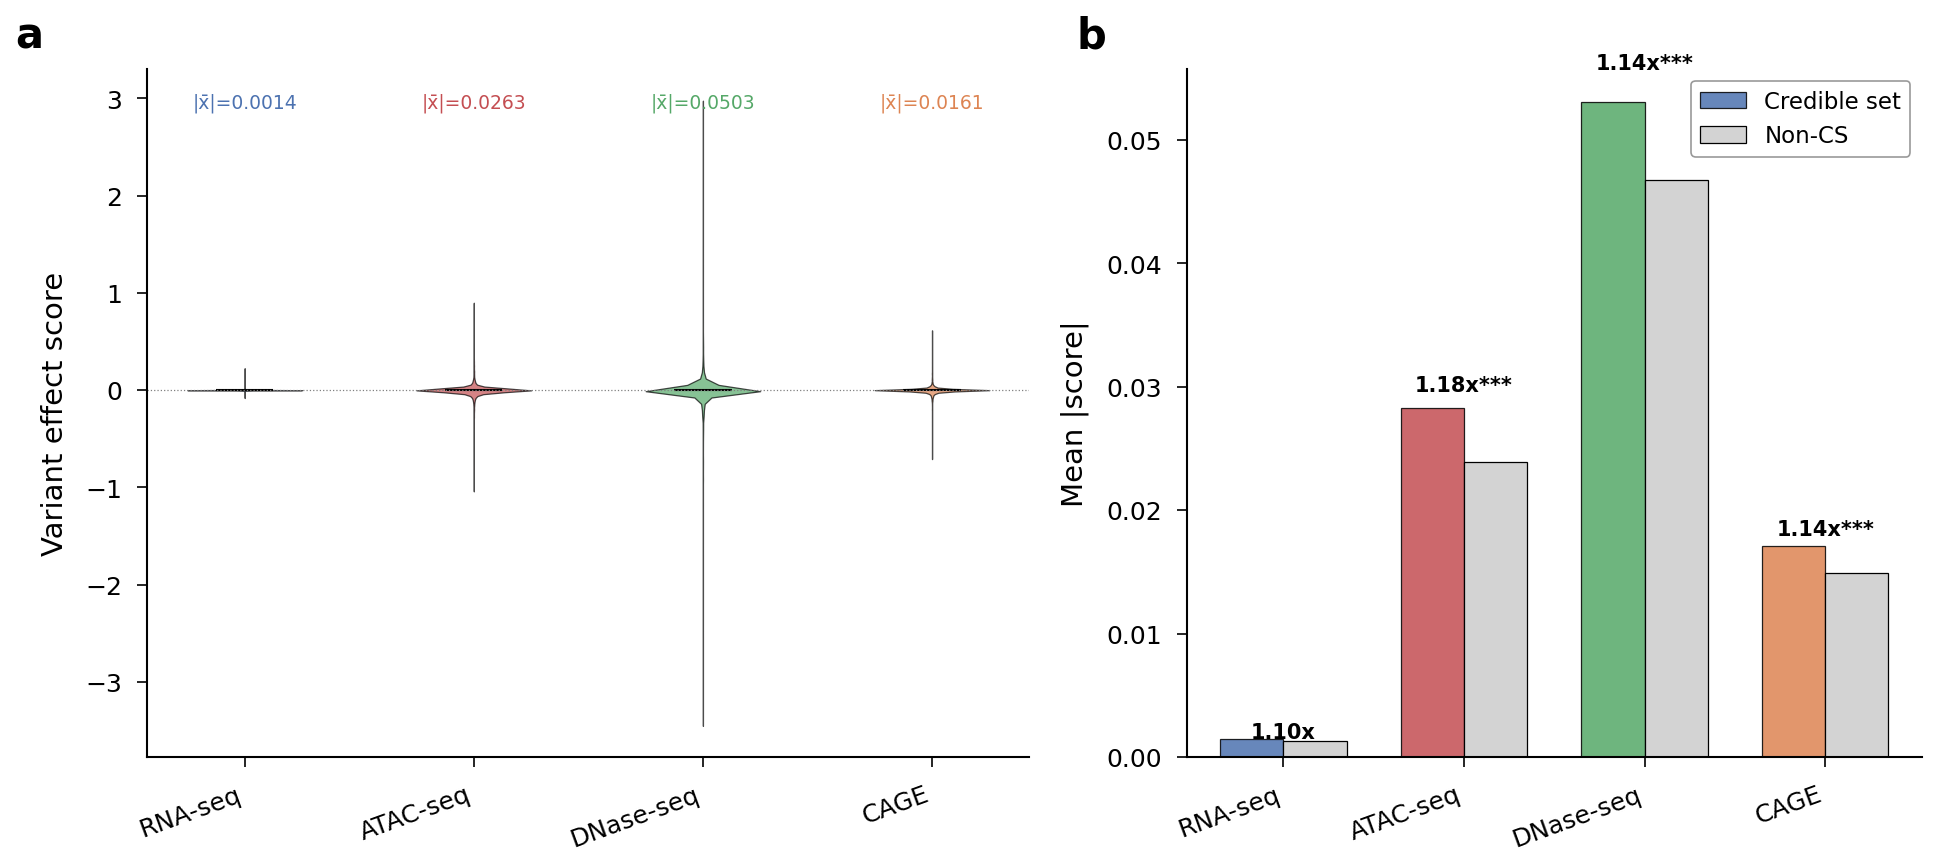 Score distributions by assay and credible set enrichment. Chromatin scores are 50x larger than RNA-seq scores and preferentially flag fine-mapped variants.
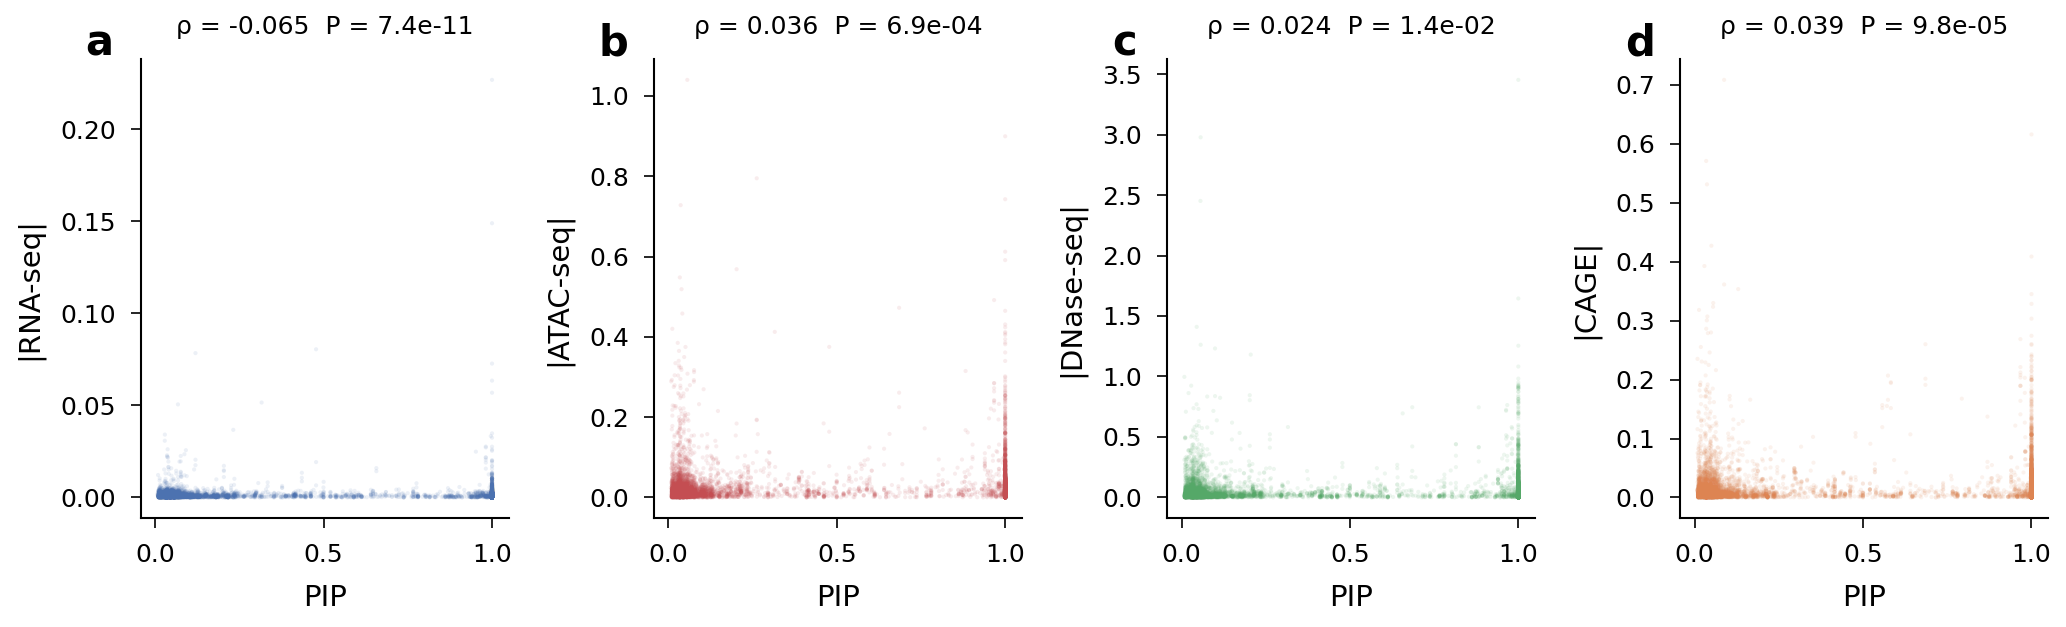 Supplementary: PIP vs |score| scatter plots for all four assay types.
Interpretation
AlphaGenome chromatin scores preferentially flag fine-mapped variants — modest but highly significant enrichment consistent with causal GWAS variants disproportionately disrupting regulatory chromatin elements. This is arguably the strongest result: chromatin scores provide orthogonal functional evidence that complements statistical fine-mapping, even if they don't predict effect direction well. The paradoxical negative RNA-seq PIP correlation may reflect that high-PIP variants often act through mechanisms (splicing, 3D chromatin) not captured by expression-level scores.
Q3: Is Concordance Strongest in Disease-Relevant Tissues?
Motivation
For a cardiac trait like AF, biological intuition predicts that concordance should be strongest in heart tissues. Additionally, genes with tissue-specific TWAS effects should show tissue-specific AlphaGenome scores — if the model captures tissue-dependent regulatory logic.
Methods
Two complementary analyses:
- Sign concordance by tissue: compared heart vs non-heart tissues
- Tissue specificity deviation: for 183 multi-tissue genes, computed how much each gene's AlphaGenome score deviates from its tissue-average (S_AG) vs how much the TWAS Z deviates (S_TWAS), then correlated S_AG with S_TWAS (Spearman rho). Within-gene tissue ranking tested via Kendall's tau.
Results
Sign concordance does not favor heart tissues. Heart AA RNA-seq concordance was 50.2% (n.s.), while Prostate (59.8%), Blood (56.2%), and Esophagus Mucosa (55.7%) showed the strongest signals.
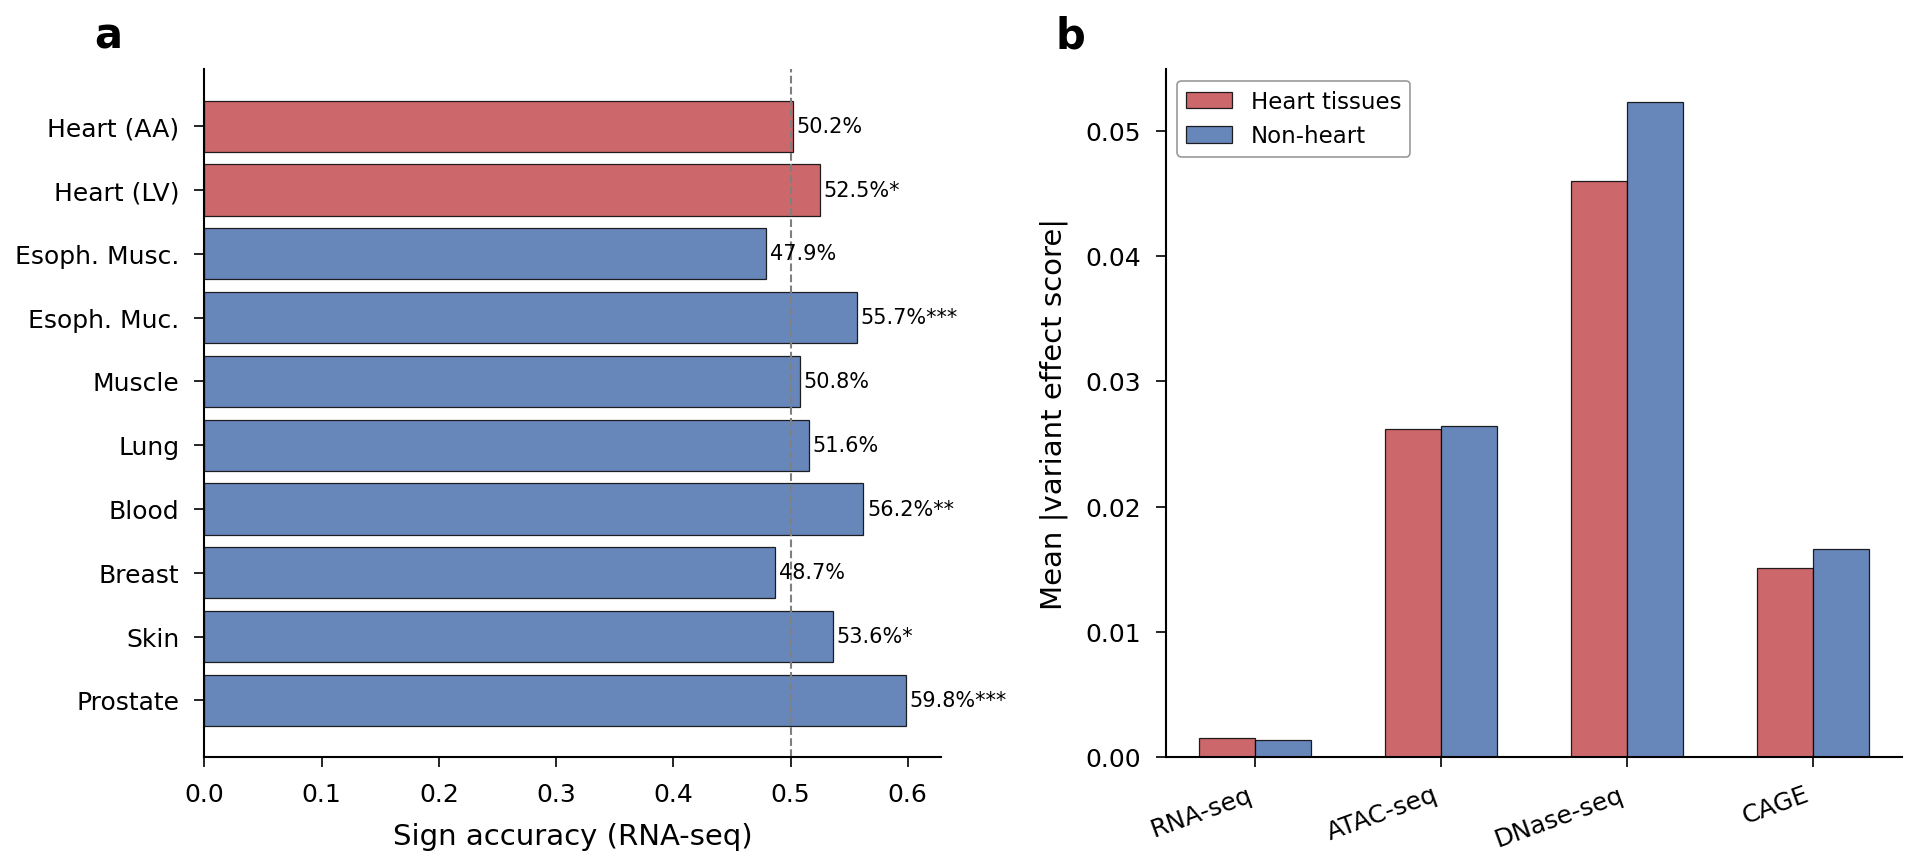 Per-tissue RNA-seq sign accuracy and heart vs non-heart effect magnitude comparison.
Tissue specificity deviation analysis revealed an interesting split between assay types:
| Assay | n genes | Spearman rho(S_TWAS, S_AG) | P |
|---|---|---|---|
| ATAC-seq | 156 | 0.317 | 5.6x10^-5 |
| DNase-seq | 183 | 0.296 | 4.6x10^-5 |
| CAGE | 183 | 0.155 | 0.037 |
| RNA-seq | 183 | 0.136 | 0.066 |
However, within-gene Kendall's tau was near zero across all assays (mean tau: 0.035-0.062), with only 4/96 genes reaching significance for RNA-seq.
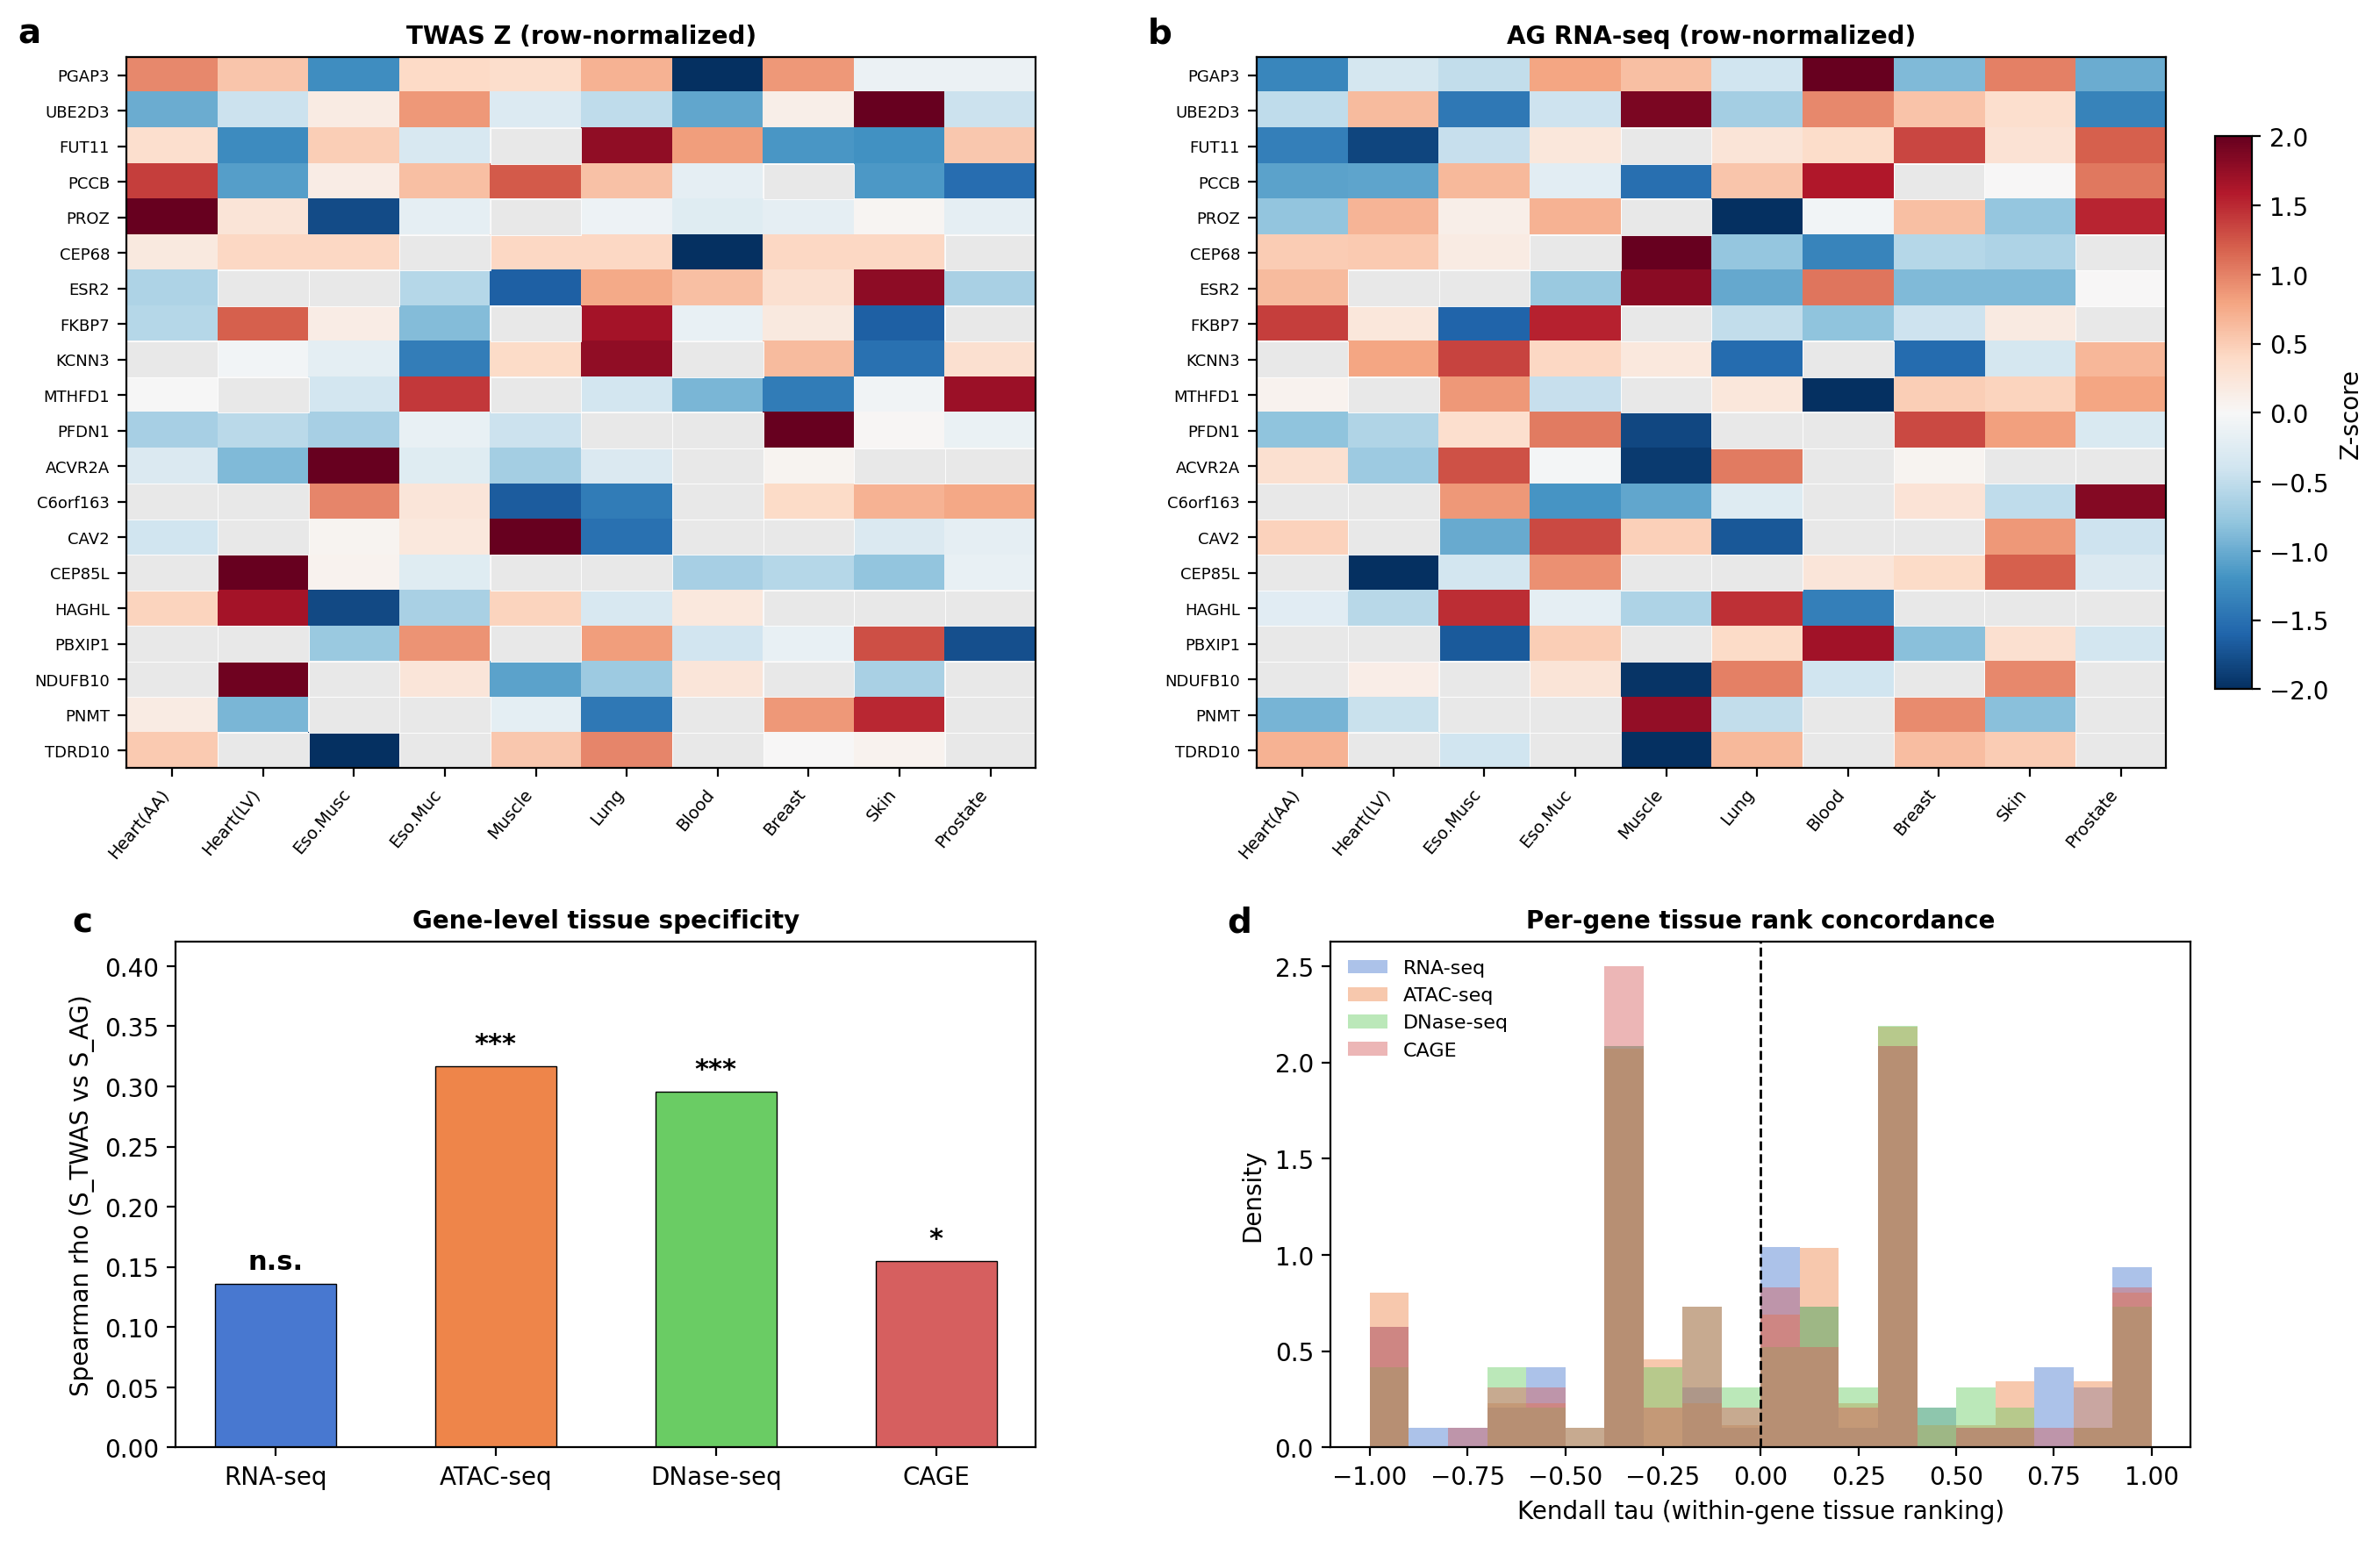 Tissue specificity analysis: TWAS Z heatmap, AlphaGenome RNA-seq heatmap, cross-assay Spearman correlations, and within-gene Kendall tau distributions.
Interpretation
A nuanced picture emerges. Chromatin assays (ATAC rho = 0.317, DNase rho = 0.296) capture which genes are tissue-specific — genes with tissue-concentrated TWAS signal also have tissue-concentrated chromatin scores. But AlphaGenome cannot predict which tissues are most affected per gene (Kendall's tau ~ 0). The absence of heart-tissue enrichment for a cardiac trait suggests AF GWAS signal is either dominated by pleiotropic variants or operates through cell-type-specific mechanisms below bulk-tissue resolution — consistent with the AlphaGenome authors' acknowledgment that "accurately capturing cell type-specific expression deviations remains a challenging task."
Q4: Can AlphaGenome Serve as "Synthetic TWAS"?
Motivation
Beyond directional concordance, can PIP-weighted AlphaGenome gene scores correlate with TWAS effect sizes in magnitude? If so, AlphaGenome could function as a TWAS proxy for traits and tissues lacking eQTL reference panels.
Methods
For each gene, computed a PIP-weighted AlphaGenome gene score: AG_G = sum(PIP_i x score_i x GWAS_Z_i), then correlated AG_G with TWAS Z across genes within each tissue (Spearman rho).
Results
| Tissue | Assay | Spearman rho | P | n genes |
|---|---|---|---|---|
| Prostate | RNA-seq | 0.384 | 0.010 | 44 |
| Muscle | RNA-seq | 0.193 | 0.072 | 88 |
| Whole Blood | RNA-seq | 0.182 | 0.143 | 66 |
| Heart LV | RNA-seq | 0.034 | 0.721 | 113 |
| Heart AA | RNA-seq | -0.064 | 0.499 | 113 |
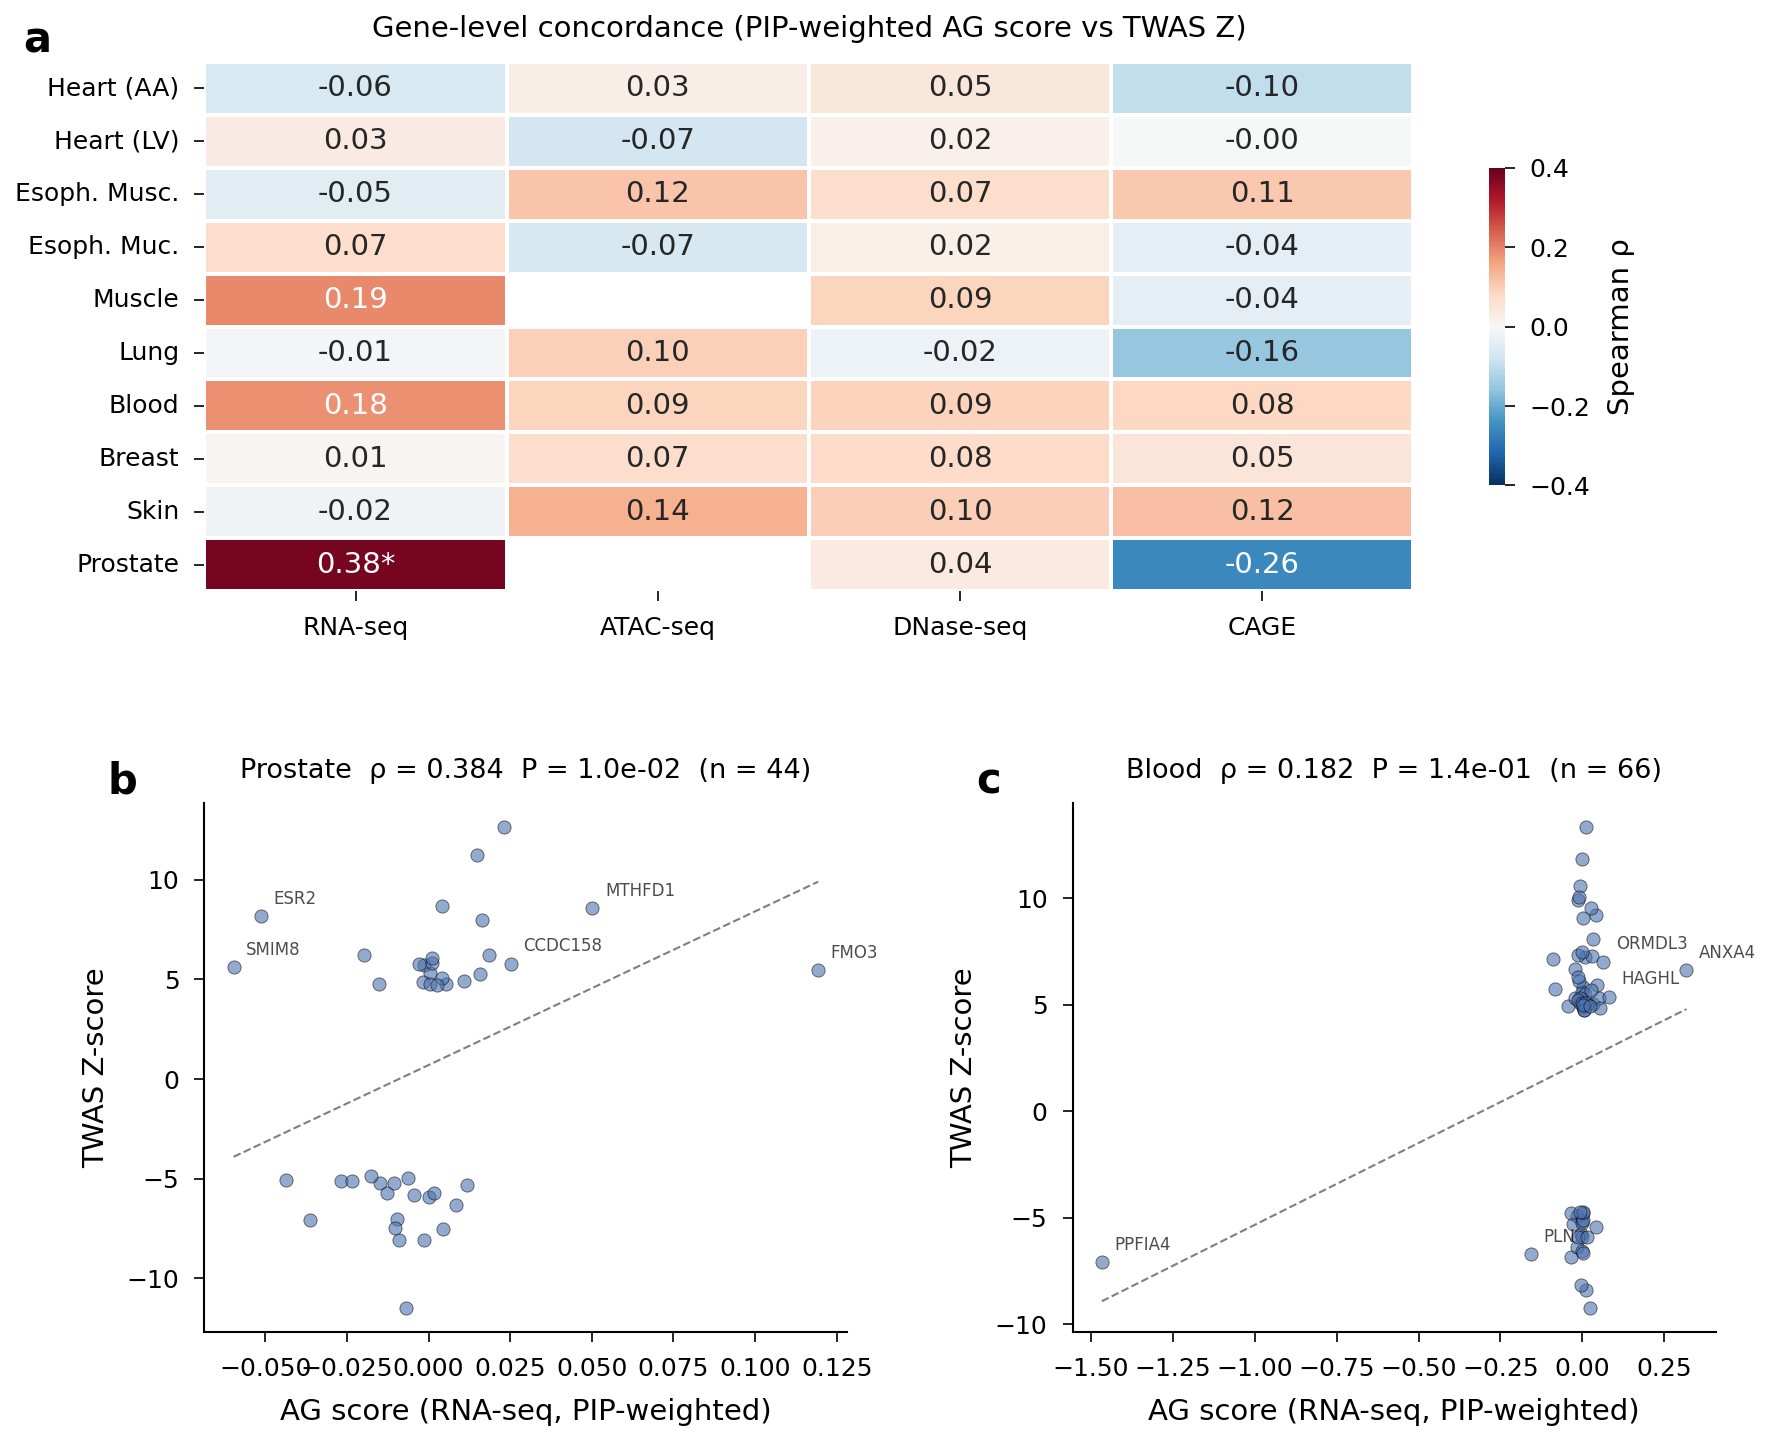 Gene-level Spearman correlation heatmap and scatter plots for Prostate and Whole Blood.
Interpretation
The target criterion (rho > 0.3) was met only for Prostate — a tissue with the fewest genes (44), so this may partly reflect small-sample variability. The disconnect between SNP-level sign accuracy (~55%) and gene-level correlation (~0.1) reflects a key limitation: AlphaGenome captures variant effect direction modestly but not magnitude. TWAS Z-scores integrate LD structure, expression heritability, and sample size in ways that single-variant deep learning scores cannot. AlphaGenome scores in their current form cannot replace TWAS for gene discovery.
Putting It in Context
A known hard problem
Our findings are consistent with a growing body of literature showing that sequence-based deep learning models struggle with variant effect direction prediction:
-
Brennan et al. (Nat. Genet. 2023) tested Enformer on personal gene expression from GTEx and found cross-individual correlations centered near zero. Among 598 genes with significant predictions, 33% showed anti-correlation. PrediXcan (a simple linear model trained on genotype data) substantially outperformed Enformer (921 vs 162 significantly predicted genes).
-
Linder et al. (Nat. Genet. 2025) showed Borzoi outperforms Enformer for eQTL effect sizes, but achieves only "low to moderate" correlations with fine-mapped GTEx eQTLs. They noted that "modeling distal regulatory effects and predicting regulatory effect direction are two important, but orthogonal, areas for future modeling improvements."
-
Huang et al. (bioRxiv 2025) evaluated AlphaGenome directly and found it "significantly outperforms" Enformer (odds ratio 3.0 for direction prediction), but "still lags behind classic machine learning models trained directly on personal-level data."
-
Schreiber et al. (arXiv 2024) confirmed that chromatin prediction consistently outperforms expression prediction across models, and that all models show distance-dependent performance decay from TSS.
Our 55-60% sign concordance falls squarely within this landscape: better than Enformer's near-chance direction prediction, but far from individual genotype-based methods. The 14-18% credible set enrichment for chromatin scores adds new evidence that pre-computed variant effect scores can help prioritize causal GWAS variants.
AlphaGenome's own acknowledged limitations
Our results align with limitations from the AlphaGenome paper itself (Cheng et al., Nature 2026):
- Cell-type specificity: "accurately capturing cell type-specific expression deviations remains a challenging task" — consistent with our absent heart-tissue enrichment
- Distance decay: "performance decays with distance to the target gene" — many AF variants lie in distal enhancers
- Chromatin > expression: our chromatin scores (|effect| ~0.05) are 50x larger than RNA-seq (~0.001), mirroring the general finding across genomic DL models
- No fine-tuning: DeepMind prohibits fine-tuning, preventing trait-specific adaptation
What would close the gap?
For AlphaGenome to function as "synthetic TWAS," several advances would be needed:
- Haplotype scoring: scoring common haplotypes rather than individual variants to capture LD-mediated aggregation
- Cell-type deconvolution: weighting biosamples by cell-type composition using single-cell references
- Splicing tracks: many TWAS genes may operate via sQTLs rather than eQTLs
- Trait expansion: testing on IBD, Crohn's disease, and other well-powered GWAS to assess generalizability
Conclusions
| Finding | Implication |
|---|---|
| RNA-seq sign concordance 55-60% in 5 tissues | Weak cis-regulatory signal — directional but not quantitative |
| Chromatin CS enrichment 1.14-1.18x | Causal variants preferentially disrupt open chromatin |
| Chromatin tissue specificity rho ~ 0.30, RNA rho ~ 0.14 | Chromatin captures gene-level tissue patterns; expression does not |
| Within-gene tissue ranking tau ~ 0 | Cannot predict which tissue most affected per gene |
| No heart tissue enrichment for cardiac trait | Pleiotropic regulation or sub-bulk cell-type specificity |
| Gene-level rho < 0.2 | Cannot serve as "synthetic TWAS" at current resolution |
AlphaGenome variant effect scores capture weak but real biological signal that complements statistical genetics — particularly chromatin scores for fine-mapping prioritization. But the gap between sequence-based prediction and genotype-trained models remains substantial. The most promising path forward may not be better models, but better integration: using AlphaGenome's chromatin scores as priors for statistical fine-mapping, rather than as standalone predictors.
References
- Brennan et al. (2023) - Nat. Genet. - Enformer personal expression prediction evaluation
- Linder et al. (2025) - Nat. Genet. - Borzoi eQTL effect size prediction
- Huang et al. (2025) - bioRxiv - AlphaGenome personal expression evaluation
- Schreiber et al. (2024) - arXiv - Review of deep learning variant effect prediction
- Cheng et al. (2026) - Nature - AlphaGenome
- Huang et al. (2025) - Genome Res. - TraitGym benchmark